A Beginner’s Guide to Finding User Needs
Qualitative research on user motivations, activities, and problems
Abstract
A Beginner’s Guide to Finding User Needs shows you how to gain an in-depth understanding of motivations, activities, and problems of (potential) users. The book is written for UX researchers, UX designers and product managers.
License

A Beginner’s Guide to Finding User Needs by Jan Dittrich licensed under a Creative Commons Attribution 4.0 International License. Some images may have other licenses (like CC-BY-SA).
Contributors
- lisacharlotterost
- Claudia Landivar
Resources
Additional information and co-documentation templates can be found at urbook.fordes.de
Suggestions and Feedback
This book is free/libre, if you help to improve it, it helps all other fellow readers. To point out mistakes you can:
- file an issue (If you are on GitHub)
- write me a mail: dittrich.c.jan AT gmail DOT com
Payed and free versions of this book
- If you/your team/your company wants to buy this book and pay for my coffees, visit its page on leanpub.
- You can read this book for free at github pages or download versions for ebook readers on urbook.fordes.de
Research focused on understanding
This chapter covers:
- What qualitative research is about
- In which projects you can use qualitative research methods
- Why research is not a linear process
Although I am a user researcher since a while, every research project still brings a lot of surprises. What me and my colleagues want to know seems rather simple in the beginning, yet often turns out to be complex and surprising: “Oh, I did not see it this way, but it makes a lot of sense now”. These surprises and complexities lead to a better understanding of why (potential) users of a product do what they do.
This book is about methods for understanding people you design for and about communicating what you learned. The methods used for this are interviews, observation and structuring the data into meaningful patterns. This is sometimes called design ethnography. In such research, you directly engage with people and data you analyze is language- or image-based. This means you use qualitative methods.
There are also research methods that use number-based data and focus on testing hypothesis using measurements and statistical analysis. These are often referred to as quantitative methods. A typical example for quantitative research is A/B testing: A/B testing compares two versions of an interface by measuring which of the versions performs better in a certain metrics e.g., how many people clicked the “buy”-button.
Note: Other research methods
Maybe this book is not what you are interested in. Perhaps you rather want to learn about quantitative research using measurements and statistics. In this case, I recommend getting Jeff Sauro and James R. Lewis’ book “Quantifying the User Experience”. If you then crave yet more math and complex methods, try Andy Field’s “Discovering Statistics” and his “How to Design and Report Experiments”.
If you are undecided whether you want to use qualitative or quantitative methods or just wonder what research methods exist, you can get an excellent overview and introduction to several methods with Erica Hall’s brief “Just Enough Research” or Goodman, Kuniavsky and Moed’s “Observing the User Experience”
Qualitative research helps you to get a holistic understanding of how a future product could be used by finding out about motivations, activities, and problems of users and gain an in-depth understanding for their activities, replacing stereotypical assumptions. For example, when people cook, it might be plausible to assume that:
- They decide what to eat
- Get a recipe for the meal
- Buy ingredients
- Cook following the recipe
- Eat
But in everyday life, people often don’t follow this clear script: It will influence their actions that their kid or spouse prefer another food than they do; They might wish for variety; they might see something that they fancy even more than what they initially decided for; they might not trust their cooking skills… If you want to build a product that supports people when cooking or shopping groceries, it makes sense to understand how people actually do it. This does not mean that initial ideas or existing knowledge should be discarded: Concepts like “Programming is typing text that makes computers do stuff” or “Cooking is combining different groceries to get a meal” are not wrong. Such knowledge is just not rich enough to develop products based on it.
There are different ways in which such understanding can be helpful for a project. In the following sections, I show several typical setups in which qualitative research can help you to develop a product.
Types of projects you can use qualitative research in
It makes sense to understand motivations, activities, and problems of potential users before a lot of time and money has been invested in product development. You can do research to understand potential users without having a working product at all and find out what their motivations, activities, and problems are now.
Still, understanding-focused research can also make sense when product development is already ongoing, as long as this research can still influence the products further development. Depending on what is already set or not, there are different project types you can use understanding-focused research in.
Research for open topic exploration
Putting research at the very beginning of a project and having it as the primary driver puts the user needs first and gives you much freedom in your research, allowing you to focus directly on the user. An example would be to explore “Sharing recipes on the web” or “the future of cooking”. If you read case studies about design research led by famous agencies, you will read about this type of research. Such projects are not common: Often there are more constraints.
Research based on an idea for a new product or feature
You want to find out user motivations, activities, and problems that are important to consider when building a product or service. This is the scenario in which I use user need research most often, for example in tasks like “We would like to build an app that allows people to curate recipes and use recipes when cooking”. The research is shaped by the initial idea, but what will be created in the end is not yet certain.
Research based on an overhaul of a product or feature
If a team plans a substantial overhaul of a product, it makes sense to observe how users are using the product to find out where needs are not being met. A task could be “We provide an app for curating and reading recipes. It has not been updated in several years, and we want to increase its use among a younger target group by providing features that are attractive for them.” The research task is rather focused: What is to be done is already mostly set, but research shall shape the way it is done.
In all of these situations, understanding users can help to shape new products and features. But what the research focuses on, is shaped by the initial goals. These constraints are an important influence on your research project. Another important factor is the collaboration with others in the research project.
Researching alone and together
Researchers can collaborate with others in different ways: Researching as a contractor is different from the research as a member of a product team.
All methods in this book work well if you need to run the research on your own. But researching alone is not a requirement: Research can and should be done collaboratively, sharing both work load and gained knowledge.
The way of collaboration depends on your way of work. The following are three prototypical models for using the methods taught in this book: Research for you, research for a team, and research with a team.
Research for you
You can research even as a one-person-team—for example, if you are an entrepreneurial developer who wants to create a product yourself. Most entrepreneurial developers talk to others about the challenges they try to solve for their users and using the methods described in this book is similar, but more rigorous.
Researching by-you, for-you gives a lot of freedom but often has only tight resources and can easily lack structure.
Research for a team
Research for a team is a typical situation for many research contractors. You develop a research question, usually together with some key representatives of client; do the research; and deliver the results back to your client. Often, people hire contractors because they do not have a researcher on their team, because the workload is too high, or because they want an outsider to bring knowledge into the team. While there is some collaboration, particularly when creating a research question and when delivering the results, you will do a large part of the work by yourself.
Research with a team
Product development often involves several people and different roles. At least you have a product manager and developers, but you might also have UX designers, UI designers, market analysts, tech writers, and many more roles.
It is important to have a common direction. This is partly provided by communicating what you find out in your research. But even the best reports can not convey the rich impressions that one has when researching. Involving people directly as co-researchers can be very helpful: You can set them up with some simple tasks and as they learn, give them more responsibilities and help them to bring in their individual skills. For me, the most common way of collaboration is people being co-researchers in interviews. They help with taking notes, but depending on their skill and confidence, they also can shape the research themselves and, for example, ask questions.
Understanding is a messy process
In qualitative research, you are constantly dealing with new people and new situations. Uncertainty and surprises are therefore part of all projects. It has been my experience that dealing with these uncertainties is one of the biggest challenges for beginners.
University teachers, conference speakers, and agencies often present research as finding clear facts with rigorous methods and execution of research in clear subsequent steps. Such models are very helpful for giving structure to your plans and actions, but they are idealized. It is helpful to keep this in mind.
When you do an actual research project, it won’t always follow a clear and linear structure. It will need iterations and adjustments. Don’t think of it failing to do “good research” when something does not go as planned. In fact, it is often a good sign if you feel that you need to adjust plans: It shows that you have learned something new and are aware of it. Plan in time for such adjustments. If your research project is only possible if everything runs very smooth, it might be at the risk of going over time and budget. Also, you and the team might not learn a lot of new things as you can only do what you have expected anyway.
Summary
- The methods discussed in this book focus on understanding and documenting the activities of people to design better products for them
- Research projects can vary in their constraints they put on research: They can be very open and explorative or suggest a solution already
- Research projects can vary in how you collaborate with other roles (or not): You can research for yourself, you can be part of a team you do research for, or you can be brought in
- Understanding-focused research methods can be challenging: Be prepared to learn new, surprising things and to adjust your plans
Preparing your research
This chapter covers:
- Defining what you want to find out in the research project
- Writing the questions you want to ask participants
- Learning about your research field before going there
- Recruiting participants for your research
- Preparing research sessions
- Preventing to harm participants or yourself
- Writing a cheat-sheet
It would be awesome if you could start with learning from people immediately. But before you meet your research participants, you need to do some preparation. It might not be the most glamorous part of being a researcher, but it is crucial to be well-prepared. Planning the research is important for you and your collaborators to get a common understanding of the research goals. The preparation is also useful for learning about the field you are going to do research in. This prepares you for the next step: finding potential participants and asking them if they would like to participate. As a researcher, you are responsible for the impact of your research—on society, on participants and on you. Anticipating this in advance prevents harm.
A good preparation will enable you to focus on learning from participants when the time comes, as you, your team and your participants will be well-prepared for the research. A good way to start with your research preparation is to get a clear understanding of what you and stakeholders of the project want to learn.
What do you want to learn?
The question of what you want to learn leads to two kinds of questions: research project questions and research session questions. Research project questions are about what the goal of the research project itself is. You will work towards that goal by learning from participants in your research. For this, you will ask your participants questions. These are the research session questions. They are questions focused on what the participants do or feel.
Before you work on the research session questions that you ask the participants in the research sessions, you should clarify the overall goal of the research project with your research project question.
Imagine, you are asked to support a company in finding out more about a business area they potentially want to move in: They currently publish content and recipes for cooking enthusiasts online and in a paper magazine. They would like to explore improving their offers to younger people who might not be cooking enthusiasts yet. You were brought in by their product manager. While your contract outlines the topic you should research, it is not yet clear what exactly you will work on in practice. For this, you create a research project question.
Writing a research project question
A research project question briefly outlines the question you want to explore in the research project. It is helpful to start your research project by writing a research project question as it will help you to think about your research and communicate it.
Research project question examples
- “How and why do students use digital media to learn better?”
- “How and why do people become Wikipedia editors?”
- “How and why do developers use Docker images in collaborative software development?”
There will be many situations in which your research touches on other people’s concerns. At least they will be interested in the purpose of your research: Curious colleagues and research participants will be happy to know what it’s about. Telling them your research project question is an efficient way to describe why you do the research. Some people have a stake in your research. They will not only be curious but want to ensure that your research helps them. This is most obvious when you’re researching for a client, but also when you are researching as part of a product team in your organization. A clear research project question helps to communicate the project’s goal. It also ensures that everyone understands what the research will be about.
In the example I use throughout the book, I’m researching for a client and I have at least one person with whom I should have a shared understanding of the research project question: The product manager.
The initial task proposal you are approached with might be vague or very broad. For example, the initial question could be “We want to find out how to appeal to younger people” or “Explore if an app for recipes is right for us”. While these are questions that the client has, they are still focused on a future product—but a product that does not exist yet, can’t be researched, so it makes sense to focus on (potential) users and how and why they do.
Here are the questions you should be able to answer before proceeding:
- What are the goals of the research project? What do you need to learn more about? For example, you might be told the following:
- “I think we do this to learn how people actually cook in practice”
- “We have been thinking about using videos in our app since quite some time, but it seemed too expensive. I wonder if we will find out that we actually should be doing that.”
- What is the context and history of the research project in the organization? For example, you might get the following responses:
- “There was a discussion if we actually want to move in this field and be more ‘tech’ and have this app.”
- “According to research we had done so far, a lot of younger people seem to have an interest in learning to cook better. However, most people we cater to are in their 40s to 50s, so I am unsure if it works for us.”
Even if you are researching for your own project, without a team, it can be helpful to ask yourself these questions and write down the answers.
The research project question should be concise. This can be difficult to achieve when many people with different interests are involved. To allow for input while keeping the research question short and simple, keep a visible “research interest backlog”, a table of smaller, specific questions and who asked them. This prevents the research question from becoming a long list of individual questions.
I have already mentioned that initial questions for a research project might be focused on the product rather than on (potential) users. Instead of dismissing the initial product focus, you transform these initial ideas and use them as a starting point to create a user- and activity-focused research project question:
- Take the initial idea for a future product (or market, or feature)
- Ask yourself why the product would be good for an activity people do.
- Take the activity from 2. and ask yourself how and why people do this activity.
- Refine the question.
Here is an example:
- The initial idea the team wants to explore is “creating an app that offers recipes and teaches cooking skills.”
- The related meaningful activity can be “Learning new cooking skills when cooking with recipes”
- Asking how and why I got to “How do people learn new cooking skills when cooking from recipes?”
- We can then refine the question a bit. The people we work with may not want to focus on enthusiasts but on people who have less cooking skills yet, given that enthusiasts are probably a more saturated market. So, we can refine the research question to: “How do people with low to intermediate existing cooking skills learn new skills when cooking from recipes?”
Tip: In many research projects, you might not just have several people who need to be involved in shaping the research project question. In this case, a research planning workshop might be helpful to gather input and to help the team to gain a mutual understanding of their interests.
The research project question serves to align, communicate and plan the research project. It is relevant to you and the people you work with, but it is not relevant to your direct work with participants in research sessions. What matters in research sessions are the research session questions.
Writing research session questions
The research session questions are the questions you want to ask participants, for example, “Can you tell me about how you cook?” They can also be invitations you want to give, like “Can you show me some recipes you like to use?” or “Can you show me around your kitchen?” Some of your questions are not voiced at all, you ask them yourself to guide your attention, for example, “Are there annotations in their recipes?”
You may have noticed that such questions don’t target specific, short answers typical of surveys, like “How much do you like your job on a scale from 1(I hate it) to 5 (I love it)?” or “Please name your most frequently used app”. Such surveys are usually analyzed quantitatively. In this book, I focus on understanding how and why people do what they do—qualitative research. I show you how to ask questions to which you can get in longer and more descriptive answers. By this, you will learn what you did not know before. Such questions are called open questions because they don’t have a pre-determined (closed) set of answers. Open questions are, for example, “Describe how you started your work today” or “Why did you add sugar to the dough?”
It makes sense to write down your research session questions. This helps you to remember what to ask and allows you to review and improve your questions. Writing down the session questions is also useful for collaborating with co-researchers: They might have good ideas about what could be asked and collaborating on the questions will help you to understand the motivations and strengths of your co-researchers.
When I start writing my research session questions, I often structure them around three themes: Motivations, Activities and Problems. They are relevant for design, and easy to remember with the mnemonic M-A-P.
Questions about motivations are concerned with what the participant wants to achieve and what is important to them. Motivations can give you context to what the participants do.
- “What is the most annoying thing about cooking?”
- “Can you tell me why you chose this recipe?”
- “What is a meal that you have not cooked yourself but would like to try?”
Questions about activities are about what the participant is doing and how they are doing it. Activities are the core of research; this is where the action takes place.
- [Invitation] “Shall we start with cooking?”
- [while observing] “How did you know the pan was hot enough?”
- “You said you are going to replace that ingredient—can you tell me more about that?”
Questions about problems are about what is getting in the way of what the participant wants to do. They can show opportunities to improve existing designs and can surface activities that are so familiar that participants don’t think about them—until something gets in the way.
- [question] “What is getting in your way when you cook?”
- [observation] Watch out for participants abandoning plans and finding new ways.
- [question] “What makes a ‘bad’ recipe?”
The research session questions are flexible and should be treated as a tool for reflection and preparation. There are usually more questions than can get answers to in any single research session.
Your session questions are not static. You should revise them as you learn more about the field. This can be done even before you speak to participants: By speaking with experts and doing desk research, you can learn about the field before you go there.
Get to know the field without going there, yet
A basic understanding of the field will help you to interpret what is going on. Otherwise, what you hear and observe can easily seem like an overwhelming amount of new terms, puzzling behaviors, and unspoken expectations. I’ll show you two ways to learn about a field before you go there: desk research and talking to experts.
Desk research
Desk research means you can do it from your desk by reading and summarizing reports, books, websites, and so forth. Ideally, you can start with easy-to-grasp introductions. For our example project, you could get some cookbooks for beginners and see how they teach cooking. It may also be worth watching some videos of people explaining cooking techniques to get a feel for how participant observation might be like.
Some areas have a lot of “onboarding material” like books, tutorials, and brochures—for example, parenting or web development. In other areas, documentation might be lacking, for example, because the field is highly professionalized (like being a pilot or a medical doctor), because some procedures are considered bad practice (like shortcuts to get work done quickly), or because the topic is considered not actually part of the discipline (like managing your finances as a freelance designer). Particularly for information on what actually happens aside of what is documented, experts might be a good source of information.
Talk to experts
Although searching the web for information is quick and easy, talking to an expert can help you answer specific questions and get tips on what to consider in practice.
Frequently, the team you work with already has some connections to experts: A company creating digital design tools will have close contact with some designers, and a company producing medical devices will have contact with medical doctors. Very often you can use these existing connections to reach out to experts who already have an established connection to your team or organization.
If you need to contact the expert without knowing them beforehand, you might get lucky, and they’ll talk with you for free. Otherwise, you’ll pay them for their time. What you have to pay varies and some experts are really expensive. But in general, talking to an expert is an efficient way to get an overview of a field and the relevant issues for practitioners.
Find people who participate in your research
Once you have written your research questions and learned about the field you want to research in, it is time to find people who participate in the research sessions. To be able to do this, you need to get in contact with them, ask if they could participate, and organize that participation. This is often referred to as “recruiting” research participants. You do this by defining criteria that potential participants should meet and by reaching out to them. You also need to set what you can pay participants for their work. Paying makes it easier to find people and makes your research more fair.
Define recruiting criteria
You are probably familiar with demographic recruiting criteria like “30-40-year-old male, earning more than $60k/year and being interested in technology.” However, your interest is in what people do and the problems they encounter. Demographic criteria are only spuriously related to that. This is why you should describe the potential research participants based on the activity that is part of our research project question.
In my example project, the research project question is “How do people with low to intermediate existing cooking skills learn new skills when they cook with recipes?”, so the activity is “Learning new cooking skills when cooking with recipes.” This is a good start, but it could be a bit easier to understand though: “People who want to improve their cooking skills and use recipes” is probably better, since potential participants could more easily relate to it and think: “Seems they are looking for people like me!”
Recruiting your potential research participants based on activities does not mean that you should ignore criteria that are not activities. Age, gender, ethnicity, and other criteria have a large influence on how people act. It will make your research more interesting and potentially more equitable if you include potential participants from a wide range of such criteria. You can set criteria for the diversity of the participants you involve in your research.
In my example project, I know that cooking, as a domestic activity, is usually associated with women. I could say, that I want at least a quarter of the participants to not be women. Similarly, if I would do research with programmers, it is a reasonable guess that many programmers are young, male, and white. Again, I can set criteria to have some participants older than 35, some non-male, and some non-white.
By defining your recruitment criteria along with the activities that are interesting for you ensures that you recruit participants who actually do what you want to learn more about. While activities are the primary criterion, demographics should not be ignored: Having a demographically diverse group of people makes it more likely to observe a wider range of ways people go about their activities.
Where does the research happen?
Research should take place where the participants are doing the activity you want to learn about. In the example project, I’m interested in how the participants cook with recipes, so their kitchen would be the place to do the research: There, they can talk about the context and show me what they do. I can experience the context and see how much space they have in their kitchen, how they use the space when cooking, and where they keep their recipes. Researching at the place where participants do the activities you are interested in, is called a site visit.
However, it is not always feasible to do the research at the site of the activity. For example, some workplaces have a strict no-visitors policy. Some audiences are distributed globally and long flights to each single participant would be very resource-intensive. In-person site visits are also not always the best way to gather data. For example, if almost all relevant interaction happens on a screen, talking and observing via video chat and screen-sharing might give you better opportunities to observe than looking over somebody’s shoulder in their office.
Knowing what your research project will be like and where the research is going take place is helpful when trying to find your participants for the research. You may also learn more about the field and the participants in the process of finding people and adjust the planned setup accordingly.
Payment and incentives
Payment for research (also called compensation or incentive) is important for two reasons: It makes participating more attractive to participants and allows some participants to participate at all, for example, if they could not afford to interrupt their usual job for talking to you.
There are several factors that influence the amount you should pay participants:
- Time spent with you, time spent with organizing, time spent traveling.
- Living expenses for the participants: A compensation that is considered just about okay in a Swedish city might be considered high in rural India.
- People who are hard to recruit might be swayed by a larger compensation.
As a starting point, you can use an online calculator, like this one by ethnio, that gives you a suggestion for a sum to pay.
Ideally, you should pay your participants in cash as this poses the fewest restrictions on participants and does not require being a user of a specific service (like using PayPal or having a bank account). It may not be very relevant to research involving middle-class people in a Western country, but not everyone in the world has a bank account.
However, paying in cash is infeasible for many organizations. It may not be allowed or only be permitted for very small sums. Gift cards or vouchers are a common alternative. Sometimes, pre-paid VISA cards can also be a good choice. If your participants already use a product of yours, you can also reduce their monthly service fees for it or give them a free upgrade of their plan.
People might reject your compensation. In this situation, explain to them that they spend time on your questions that they are experts in what you want to learn about, and that it is only fair for them to be paid. Participants may not be allowed to take any compensation, for example, because they work for the government. If people reject the compensation or are not allowed to take it, it can be a nice alternative to instead offer to donate the money instead and let them choose from a list of well-known charities to choose where the money should go.
Tip: Sarah Fathallah’s article “Why Design Researchers Should Compensate Participants” discusses not only the “why” of compensation but also typically raised objections to compensation.
If your work is commercial, pay your participants. However, if you do research as a student or for a small NGO you might only have a very tight budget and people might be supportive of your cause already. If this is the case, I’ve had good experiences with giving a small gift to people—some premium chocolate bars or the like. The costs are relatively small and participants enjoyed the gift a lot.
Plan how many participants you need
There are no clear rules as to how many participants you need. However, most of my projects had more than three and fewer than twenty participants.
If you have done quantitative research in the past, this will seem like a very small number of people. Indeed, it is plausible to assume that user research with more participants is generally better in qualitative research as well. However, unless you invest more resources, more participants would mean shortening each research session, asking fewer questions, and skipping participant observation. But you need time with each participant if you want to understand how and why they work the way they do. To this end, several sessions in a hurry yield less useful results than research with one participant done right.
Nevertheless, doing research on only a very few users restricts the range of behaviors and opinions that will be reflected in your research. For example, you may not notice that different people have different preferred ways of doing activity. Also, you may not see which patterns are consistent across different people and which patterns vary.
My rule of thumb is to have 3 to 7 participants in each user group. Our user group in our example project would be people who have low to medium cooking skills and who cook with recipes. This means that if you want to learn about many groups of people, you also need more participants to cover these different groups. Our research question is currently focused on beginners, but we would need to recruit more people if we would also be interested in people who consider themselves cooking enthusiasts.
When estimating how many participants you need, consider how much time or money you can spend on doing the research. Each additional participant gives you additional data and a broader view of your potential users. However, each research session needs time and adds to the amount of data to be analyzed.
An efficient way to include the “right” number of participants is to do your research iteratively: start with two or three participants and analyze the data (How to do this is described in the section on analyzing data). Take a look at the preliminary findings: If the results seem clear and consistent, you can do research with a few additional participants to refine and check and explore details; or, if time is up, leave it as it is.
If preliminary findings are unclear or contradictory, you may need to include more participants.
Reasons for such unsatisfactory results can be:
- The participants encompass different groups of people with different needs—For example, for cooking it may be important whether participants are parents who cook for their kids or whether they just cook for themselves.
- The topic of your research is too broad—for example, “How and why do people cook” would be very, very broad.
- Even if your research is focused and involves only one single group of participants, the actual patterns may just vary.
In all these cases you can include more participants—but try to check beforehand whether you…
- …need to clarify your research topic (to focus your efforts)
- …need to specify the group(s) involved more clearly (to recruit the right participants)
Coming from research based on measurements and statistics, refinement of criteria during research will feel very unusual or even like cheating. But qualitative research follows a different paradigm. The research I describe here aims at understanding and describing. To do this, it is not only fine but advantageous to do our recruiting iteratively, since we can build upon our improved understanding.
Recruit with an agency
Recruiting participants through an agency costs money but saves your work. It also means that you relinquish control of recruiting details. You provide the agency with your recruitment criteria (also known as screener), how many participants you need, and when you want to conduct the research sessions. The agency will get back to you and tell you the cost and an estimate of when they will have found your participants.
Agencies usually have databases of possible participants. They filter their databases according to your criteria for the desired participants and will talk with them to find a time that works for them. The agency will typically get in touch with you after a few days and give you a list of names, times, and contact details of the participants.
Each recruiting agency is a little different, but they will tell you what they need—and they can answer your questions if you are unsure about something.
Recruit by Yourself
Recruiting by yourself might be needed when you do not have the budget to pay an agency or when it is easier for you to find participants than it is for an agency—for example, because you are familiar with the group of people you would recruit your participants from.
Let’s see what needs to happen for people actually joining your research:
- They know about the possibility of participating in the study.
- They are motivated to actually participate.
It is motivating for potential participants when the research improves their lives: A shopkeeper will likely be interested if you work on making it easier to keep track of bills; neighbors will be motivated to help when you try to make living in the neighborhood better. Another important factor can be being reimbursed for time and effort.
When you know what you can offer to potential participants, you can write down what they can expect when they participate. This includes:
- What the research will be about
- How much time it will take to participate
- What the research will be like/what you will do
- Why they might want to participate, including:
- How the research results might benefit them or others
- What they get as an incentive
You can use this information to reach out to potential participants.
After speaking to the team you learn that you could recruit potential participants through the company’s website. When talking to a web developer in another team, you find out that the company could add a small recruitment banner to existing content and limit showing it to the geographic area you are located in.
So you ask them to add to all recipes of the “Beginner” category a little banner that says:
Participate in a study on cooking and recipes
This leads to a page that says this:
We would like to learn more about how people use smartphones and tablets/iPads for recipes and for learning to cook better. We’re looking for people who do not yet consider themselves cooking enthusiasts—so if you are still learning, that’s not only fine with us, but actually helpful! In the research, a member of our product development team would visit you and look over your shoulder while you cook. This would take approximately 1:30h. If you like to participate, please fill out this form: [contact form]
In the previous example, it was easy to reach out to participants because they were already using a product of the company you work for. But sometimes, field access is harder than just putting up some notes or banners. Often, this is because you actually don’t know where to find potential research participants yet. In this case, you first need to do some research to find them.
Here is an example for a scenario where accessing potential participants is more complex: Working with an NGO on using citizen science for environmental protection, you want to find out how people use freely available data on air pollution data, published by the city administration. However, you don’t know anyone who does work with such data. You give it a try and post about your research project on Facebook. A friend of yours answers. He happens to know that a local hackspace is hosting a bi-weekly data for good-meeting. The friend sends you a link. On the linked page, you find the meeting organizer’s email address. You write them an email and ask if you could join the meeting and introduce your project.
In the previous example, I outlined a step-by-step process of reaching out: In each step, you try to be referred to a next person who is more knowledgeable and familiar with the people you want to do research with. You do this, until you are referred to possible participants.
At each step, you can learn how to approach the next one: If your friend refers you to a meeting of data hackers, that friend can probably also tell you how you should present yourself and what you should avoid doing. Implicit rules are also relevant: For the hacker meeting, it might make sense NOT to wear a suit. In other places, the smart clothes might be helpful.
Some people who could help you are in a position that allows them to give or deny you access to potential participants. The ethnographic jargon for them is gatekeepers. They can decide to help you and let you through the metaphorical “gate” to your research field and your participants—or they can stop you, if they have reasons to do so. In the preceding example, a gatekeeper could be the person who runs the “data hackers” meetup or the person being responsible for the city’s open data initiative.
Once you have found people who would like to be your research participants, you can ask them if they know others who would also like to participate. This is also called “snowball sampling”.
In any case, it is useful to consider different ways to get to your participants. If one way fails (for example, friends of friends), you may be successful in another (such as writing a mail to a contact person of a community). In case several approaches work, you get more potential participants. But more importantly, you now have a more diverse group of people, leading to richer results.
Invite participants to the research sessions
When you have found people who want to participate, you can schedule the research sessions with them. If you are recruiting with an agency, the agency can do this for you, but since there are varying levels of support from agencies and because you may be recruiting by yourself, I will guide you through the whole process.
Let participants know what to expect and ask for their consent
To help attendees decide whether to participate in the research session, share information about what to expect and what you’re going to do with what you’ve learned. After the participants are informed about the project, they can decide to give their consent by signing a consent form.
However, treating it as just a form-to-be-signed hides that consent and the information given for it are a vital part of the communication between researcher and participant. You should shape the process of informed consent so that the participant is always in charge.
You should share relevant information and ask for consent early on. For examples, you can send the information about your project and the consent form a week ahead of the research session. This is better than presenting the information and consent form the first time at the beginning of the research session, with the clock ticking and the researcher expecting a “yes” gives the participant little autonomy, although it might suffice legally.
When preparing the information about the research project, I usually include the following information:
- What the research is about
- What the research will be used for
- What the research will be like
- If there are any risks that I am aware of
- How much time the research session will take
- What the participant gets in return
- That the participant can ask me at any time if they have questions about the research and a contact to do so
- How they can consent (that is, should they sign it on paper? Send me a mail?)
In the following example, keep in mind that the correct way for your research may look different.
Hello [Name],
You said you were interested in taking part in a study. My team and I are trying to learn more about how people use recipes on their smartphones, tablets, or iPads. The research sessions would take place in your home and take about 60-90min, at a time when you will cook.
It is very important to me and my colleagues that we do not test you in any way. There are no wrong answers or wrong approaches.
There are no known risks of this research, but still: You can end the research session at any time without giving a reason. You will still get the compensation.
I will record our conversation, which will help me to focus on our conversation instead of taking notes. I will only use the recording to supplement my notes. I will be the only one accessing the recording.
What I learn from you will only be used to improve our products and nowhere else. You can ask the researcher questions during and before the research session. You can contact them under: researchermail@example.com
I have attached our consent form to this email. Please fill in the date and sign it with your name and send it back to me.
If signing a paper is not possible—for example because you are doing the research remotely—you can also ask the participant to send you an email with the text, “I have read the forms attached” or by having them write their name in a shared document or something like that.
With the consent information and form, I also send out a short survey.
At the beginning I usually ask which pronouns they prefer. This helps in the research session to address people properly and to represent them faithfully in the research results. You may think that you can guess people’s pronouns correctly from the name they used in a contact mail or from their appearance. But guessing by looks and getting it wrong can be embarrassing for you and hurtful for the participant, and guessing from name has its limits, too. Some names are not clearly gendered, particularly if you research across different languages and cultures. For example, Andrea might signify female gender to you, but people from Italy would expect it to signify male gender. So, it is easier to just ask.
Asking for pronouns
What are your pronouns?
- He/Him
- She/Her
- They/Them
- Self-describe: _ _ _ _ _ _ _ _ _ _ _
If there is no obvious risk associated with the research, I also ask how they want to be referred to in the study results. I usually give the choice between “Pick a name for me” and a free text field for their name with the note that it does not need to be their legal name.
Self-defining option for one’s name
How would you like to be named when I talk about you in the research?
- Pick a name for me (pseudonymous)
- I would like to be named as: _ _ _ _ _ _ _ _ _ (can be legal name or a nickname or any other name you like to used)
In many cases, it can be helpful to check for basic demographic variables too, like age ranges or where they live to ensure that your research is not accidentally excluding certain demographics. What is important here depends on your research topic. When you research in higher education, for example, you might want to ask if a person’s parents have already attended college; if you research around mobile apps you might want to know how familiar a person is with certain technologies, and so on.
Tip: Creating surveys, even if they are short, is not easy. If you know people who have experience with this, ask them to review your questions. If not, you can find best practices online that demonstrate established ways to ask commonly used questions.
Setting the date and time for the research session
If you recruit through an agency, they will usually take care of the coordination for you. If not, it is up to you to ensure that participants remember the time and place to meet. The following are some relevant aspects to keep in mind:
- Be clear about time and date: Even if it is a bit awkward, I try to be very clear about time and date. I mention the day of the week, day, month, and time in my mails or phone calls. If I research internationally, I also mention the time zone I talk about. In an email, that might look like: I could meet you on Monday, the 8th of November, 1pm (“Berlin time”/CET). Sending a calendar invite is also helpful as the calendar apps automatically convert times, and it makes it easy for participants to set a notification.
- For remote meetings, be clear about the technology used: Most video chat software runs also in any modern browser, so people do not need to install a special software. Let participants know how they can join the call. If you use a software you are not familiar with, give it a test run first.
- For real-life-meetings, find out if there are any special requirements: Places have their own rules in many cases. I share what I expect with participants, so they can fill me in if the expectations would not match: “I will come to Big Street 6 and ring the bell for ‘Miller’” and maybe they tell you: “Oh, right, the bell has the name of my flat mate, Nguyen. So, ring there.”
Getting clarity on date, time, technology, and place helps you start the research session without problems when time comes. In the next section, I want to cover some less obvious issues. However, they can have dire consequences, and it is important to consider them.
Bad things that can happen—and how to prevent them
Research should yield helpful results, but even more importantly, it should not cause harm to you or the participants. “Harmful research” probably conjures up images of non-consensual experiments in medical research which feels very far distant from the research you are doing. But your research can also cause harm. By considering possible risks and avoiding or mitigating them, you can research ethically and in a way that does not harm you nor the participants.
Preventing harm to participants
As a researcher, you have experience in doing research and you can determine how you carry out the research. Participants have no experience in being participants nor can they easily control how the research is conducted. This makes it essential for you to plan ahead to prevent harm and make the research a good experience for your participants.
Participants should be well-informed and feel prepared before the research, they should have a good experience when they are in the research session with you and there should be a positive outcome for them afterward.
Fairness
The participant does actual work to help you learn. They take time to participate in your research, keep that time free of other commitments, take care that they are there on time and last, but not least, they also do share knowledge and skills that often take a long time to acquire. This work they do should be honored. Paying them is one aspect of this. Another is to use the data well and not do research for research’s sake or because someone said that “more participants are better”. In order for participants to judge whether your research is fair for them, you need to share what the purpose of the study is and how you will reimburse them.
Participant autonomy
People should be free to choose to participate in your research and also what to share with you and how. This means that you may not get answers to all of your questions or may not observe everything you like to observe. You have to accept that.
Participant safety
Much of user need research is not particularly dangerous. Nevertheless, research that can cause physical harm indirectly (imagine researching how people navigate in traffic—distractions could lead to accidents) or research topics that are particularly sensitive (for example, researching with victims of crime). The concerns for participant autonomy are particularly important here, as people often know when something will cause them harm. However, they might not act on it in order to be a “proper research participant.” If you research in fields where physical or psychological harm is a possibility, it makes sense to speak with domain experts, particularly those from the group of potential research participants to get an assessment of your plans.
Protection of identity
There are many reasons why participants do not want to be identifiable. They may just do not want others to know that they are “bad at computers.” It also could be that you observe real work processes that are not exactly like their bosses dictate. For vulnerable populations, it might be the case that they have a stigmatized cognition (for example people having schizophrenia) or targets of law enforcement (such as undocumented immigrants). Thus, the identity of your participants should be protected. This can be achieved by not using their usual name but a made-up one and by describing your observations in a way that context clues do not reveal their identity.
For example, pseudonymizing research is a standard procedure: You replace the names of the participants with other names to protect their identity. However, being credited and being shown with one’s own name can also be important and a matter of pride for the skilled participants. In many research projects, I thus give people the opportunity to self-define how they want to be referred to in the research reports.
Note: Laws to protect personal data: GDPR and CCPA
There are laws that protect participants’ personal data in many jurisdictions. The most relevant regulations are probably the California Consumer Privacy Act (CCPA) and the EU’s General Data Protection Regulation.
There are differences between them, but their basic idea is to give people control over their personal data and what can be done with it.
This means that data can’t just be collected, stored, and used for whatever a company likes. Data needs to be collected for a specific purpose and then used for this purpose only. In addition, the personal data needs to be deleted again if it is not needed anymore or if former participants request it to be deleted.
Personal data can be the person’s name, but also their email address, their age, and their gender. You use such data to get in contact with participants and to process incentive payments. Before you collect such data, you should have a plan for how to delete it.
The organization you work with might also have faced similar questions before and a concept for handling personal data is already in place.
The safety of participants is essential. However, do not forget that research might also carry risks for you as a researcher.
Preventing harm to yourself
Just like the participants, you should not feel uncomfortable during the research. It is okay and professional to avoid research situations that are dangerous or just feel dangerous. Err on the side of caution.
In some situations, it may be safer to research together with another researcher or a colleague who likes to assist you. This way, you so can look out for each other. It is very common to have a main researcher and a note-taker, anyway. It is also fine to arrange to meet at places where you feel safer or to shift a meeting online so that both sides can call from whatever place they feel fine at.
Only a fraction of research topics are inherently debilitating, but in some projects, you might hear sad or shocking stories from participants. For example, if you are researching for a hospital you might hear about shocking diagnoses from participants. If you take on such a project, consider whether you are ready for it. It is professional to know your limits to refuse the job. If you are reading this book, you are probably a beginner in user research and may want to gather research experiences before researching inherently difficult topics. Personally, I would only take on such projects if I could collaborate with subject-matter-experts since there would be high risks for me and the participants.
Regardless of the topic of the research, it is important to take the time to process what you have learned. If you are conducting the research with other people, do a joint debrief after the research session and talk about what you learned. Hearing something sad or irritating can happen even with very mundane topics. Talking about it helps you to put it into context. Debriefs also jog one’s memory and you can use them to supplement notes without haste.
Beyond individual harm: Ethics of project outcome
Research can be a lot of fun and make you money. It can also be immensely motivating to be involved in the development of a new product. The culture of the tech industry is driven by the idea of being a force for good by creating greater efficiency, information, and connections with the technologies it introduces. User research is often part of creating these technologies—and what we enable with our research is also a question of ethics.
The technologies we help to develop also might do unjust things more efficiently, they might encourage the spread of false and inflammatory information or destroy existing social fabrics. User research can advance such developments, too. For example, research into people’s ideas of good social relationships can be used to make them spend more time on social media. Such research can be done perfectly ethically by itself, but its outcomes might not be ethical at all.
You too have to pay your bills and in many cases, it will not be possible only and always research on projects you are 100% aligned with. But be aware that technology has social consequences and that your research can be part of building that technology.
Write your cheat sheet
A cheat sheet is a little memory aid that you can take with you when you collect data. Most of the cheat sheet will be topics you want to explore and the questions that you want to ask.
Recipe use research cheat sheet
User Code:_______ , Date: ________
- Tell the reason for research: Learn about how people use their smartphones and tablets when cooking.
- Tell how the research session will be (asking, listening, observing; 60-90min)
- Ask to read the consent form again and sign if OK
Intro
[mutual introduction]
- “Can you tell me a bit about how and when you cook?”
- “Can you tell me about your use of recipes?”
- …
When writing the questions, start with the general topics and progress towards more specific ones. This is the order that makes sense over the course of a research session. Nevertheless, the sequence of questions is just a helpful guess. You will usually deviate a little (or a lot) from your cheat sheet.
I often include a checklist on the top, especially when it comes to legal matters, such as signing a consent form. That way, I can check off what I have already done and immediately see if I have forgotten anything.
You may be wondering about the “User Code” in the previous example. When I do research, I give every participant an identification code that can be used in place of their name (like “User2”). Later, when you publish the research, you want to retract all names and other identifying information. Such code allows you to identify participants without their names. This is useful for maintaining participant privacy. If you need to keep the names, you can keep a separate list that matches participant codes and legal names. This way, you can revert the codes if necessary. An alternative to codes is to ask participants how they would like to appear in the (published) research.
The cheat sheet is a tool that will support you during the interview and help you when your mind goes blank for a moment. It is not intended to ensure that you ask all questions in the same manner and in the same order. Rather than controlling the situation, qualitative research emphasizes exploring the situation. If the participant does or says something that is new to you, use it to learn, and feel free to come up with new questions that are not on the cheat sheet.
Summary
- Define what you want to learn in the research project by formulating your research project question.
- Define what you want to learn from participants by writing your research session questions.
- Get to know the field before you go there by desk research and asking experts.
- Recruit based on activities, not demographics.
- User need research is in-depth, with few participants.
- Pay users for helping you.
- Prevent harm by assessing the risks the research itself could pose to you and participants as well as the harm a product your research is helping to create could do.
- Write a cheat sheet with the questions you want to research, and what you want to observe and ask.
Learning from research participants
This chapter covers:
- Preparing your research sessions
- Observing, listening and co-documenting with research participants
- Collecting data for later analysis
You have prepared your research, arranged a meeting with a participant, and informed them of what to expect. Now you are ready to learn first-hand about the participant’s motivations, activities, and problems by meeting them, listening to their stories, and observing their work.
This chapter gives you guidance of how to learn best from your participant. A large part is about asking questions and guiding conversations. You are also interested in what people do. To learn about activities, your conversation is mixed with participants demonstrating their work. You take notes and pictures to aid your memory. Participants can take an active role and document their work: You can involve them in drawing diagrams of processes or social relations, to document their work together. At the end of the research session, you will summarize what you learned and give the participant an opportunity to ask questions. After the session ends, you will complement and organize your data. Only then is the research session over.
It is a common misconception about user research that it is asking what people want or how much they like a feature. But your research won’t delve into future ideas and designs—you are not going to ask “do you think that [a gadget] would help you?”
It is hard to guess if an imaginary thing would be great to have in the future. Instead of working with product ideas, you will learn the how and why of your participants’ activities. This allows you to evaluate your ideas (“Are my ideas consistent with what participants consider essential?”) and get inspiration for new ideas (“how can I support this activity?”).
See your participants as competent in what they do: they are experts in their daily work. This goes against the notion that people “don’t get it” and need help from designers and programmers. Assume participants have a reason for doing their work the way they do it. If you’re wondering about the actions of the participants, find out why they act the way they do.
Before you learn from the participant, let’s go over what you need to prepare.
Set up the research session
Preparing the research session prevents later problems. Send a reminder to participants and have your recording equipment ready.
Remind participants
It can be helpful for you and your participants to send a short reminder mail to participants the day before you meet them. (If you recruit via an agency, they might do it.) Here is an example:
Hello Sarah,
I look forward to meeting you tomorrow at Small Avenue 123 at 12:00pm. If you have any questions, please feel free to reach contact me.
Jan
If you are coming with a research partner, let the participant know, so they are not surprised if a second person comes. Also tell the participant know your research partner’s name and pronouns, so the participant can address them properly.
Prepare your note-taking and recording equipment
To collect data, you should have your recording equipment ready. This is what I usually bring along for in-person meetings:
- Printed Cheat sheet (I described how to write a cheat sheet in a previous section)
- Paper on clipboard: You might need to write on your lap or while standing.
- Pens or pencils: Whatever you like to use. If you plan to sketch or co-document with the participants, take some felt pens in black, red, and green along.
- Audio recorder: A simple device for about 50€ is sufficient. It should connect to your computer via USB or take micro SD cards, so you can transfer the files on your computer easily. More expensive models, like a Zoom H2, have better microphones and more settings. You can also record with your phone if the quality is fine for you. Test it beforehand in an environment similar to where you will hold the research session.
When you meet online, the tools are different. In this situation, you should have the following prepared:
- Video-conferencing app: There are many of them. Which one you choose depends on your organization, potential legal restrictions (like GDPR) and participant preferences.
- Headset: Often has better sound quality than the built-in microphone. If you want or need to use your built-in microphone, check how audible keystrokes and mouse clicks are—on some devices they drown out any other sounds!
- Printed cheat-sheet: Opening it on your computer would take up screen space that you might want to use for the video chat and notetaking.
- Writing on paper or computer: Both writing in a text file or writing on paper is fine. If you can touch-type, you can write notes and look at the camera.
- Whiteboarding-app: Whiteboarding apps like miro, mural, or tldraw are a remote equivalent to pens and sheets for collaborative activities. They’ve improved a lot in recent years, but ease of using pen and paper is still unmatched—your mileage may vary, especially for people who are not familiar with such tools.
Brief your research partner
If you are conducting research with a research partner, you should have a conversation about what you are going to do in the research session, how you want to divide tasks, and what you both should be aware of. Your research partner should also know when and where you are going to meet for the research session itself and if they should bring equipment.
It is common for research partners to be new to user research but curious about it. If your research partner does not have experience with user research, it is best if they start with supporting tasks like taking notes. In a later section I explain how to take notes, sketch, and make photos and audio recordings. It’s also good to show your research partner an example of notes from previous research. It may be unusual for them to make detailed notes instead of summarizing strongly. For example, they may only write “Likes the software” when the participant talks for a couple of minutes how they like to use a product. An example easily shows what you think the notes should look like.
As your research partner gains experience, they may take a more active role from time to time. If you think that your research partner can and should ask the participant questions, tell your research partner—otherwise they may not. Remember that, if the research partner takes an active role, you need to take the notes.
How to start the research session
When you arrive at the location you do the research at, greet the participant and take care the both you and your co-researcher (if present) are introduced to the participant. Usually, a short bit of small talk will follow. This is pretty normal and it happens intuitively. It helps to build trust and to get used to the research situation. But after a brief time both you and your participant will want to get started with your research session proper. You can initiate this by saying something like:
“So… I’m happy that we can do this and that you could free some time for showing and telling me about your experiences with cooking with online recipes.”
Give some context of why that is interesting to you:
“We are thinking about improving the usefulness of the recipes that we present to people. We have some enthusiasts in our community, but also a lot of people who do not consider themselves particularly good at cooking and we are wondering what we could do for them.”
Explain that you are here to learn—and not to judge the quality of the participant’s work:
“…that’s why we would like to know more about how you cook and how you use recipes or videos for it. This is not a test. No matter if you cook elaborate meals or not: You are an expert in your kitchen, you know best what you need, and we like to learn more.”
Although you may have already described the time frame and the research method when recruiting the participant, tell them again what you will do:
“We will talk about your work and will ask some questions. In addition, I’m interested in watching you cook. This is, as we talked when we had contact via mail, why we came slightly ahead of the usual time you prepare your meal. The whole process takes about an hour.”
In case they did not already agree to the consent form via email, you can use a written consent form and explain its purpose and content.
The participant must know how you record data and who will access it, even if they already agreed to recording before via mail. So, tell the participant:
“I’d like to take notes, and, in addition, record audio—if you’re okay with that. The recording helps me to focus on your work, because then I don’t have to concentrate on writing everything down. A colleague and I will listen to the audio for transcription; We will anonymize the transcribed data before we share it with the product design team. If you feel uncomfortable with being recorded at any time, we can pause or stop the recording.”
In my experience, it is rare that someone does not agree to being recorded. If that happens, you can ask politely if they have any specific worries—they might agree when they have additional information about how the data is used and handled.
This is an example form an in-house research project, where I visited a programmer from another department in a larger company. After explaining the process, the participant said this:
Participant: “Audio recording… I’m not sure…”
Researcher: “That’s fine with me. May I ask what worries are?”
Participant: “Hmm… yeah, aren’t you from HR?”
Researcher: “I understand your concern. It is fine if you don’t agree to the audio recording. I can assure you that HR is a separate department. We work in the product department on internal tool, that is, we help to improve the applications you use to do your work.
We do not share personal data and what we record today is not accessible to them. Also, any data that leaves my computer or the one of my colleague is anonymized, and we remove any data that points to you as person, including the names and so on.”
Participant: “Oh, sure, them… I just assumed you were from HR and wouldn’t have liked the recording thing, you know.”
It could have happened that the concerns of the participant were not resolved by me clarifying that I am not from Human Resources. If they were still fine with the research, but not with the recording—so be it. We would have taken notes instead: It’s their choice.
It goes without saying that it is important that you accommodate the participant’s wishes and respect their agency. There may be situations where the participant, for example, hesitates to respond or seems uneasy, possibly because of a question or a request of yours. Do not push them if they seem uncomfortable, even if you want to hear their answer. Offer them a way out of such situations if you unintentionally caused one. You can, for example suggest an alternative task or say that it is fine not to answer and go to the next question. The well-being of the participant is your primary concern.
Note: Dealing with difficult situations
Most research sessions go smoothly—but if you are worried about being offhand in a sticky situation, I recommend “The Moderator’s Survival Guide” by Donna Tedesco and Fiona Tranquada: Bite-sized, actionable advice for all sorts of researcher problems.
Now you and the participant are ready to move into the conversation about the topics you want to learn about. To do this it’s helpful to consider how you can learn from the participant.
Methods to learn from participants
You can engage with participants in several ways: listening, observing, and co-documenting their activities. Each method has its own strengths, and provides insight into different aspects, so it’s common to combine different approaches.
Listening and asking questions
A common way of learning from a participant is by asking questions and listening to the participant’s answers. Aim for rich, story-like descriptions that about the user’s motivations, activities, and their context. To encourage the participant to provide such story-like answers, you often need to ask for descriptions of an activity and the reasons for doing it. So, your questions may be something like this: “Can you tell me why you chose this recipe?” or “You said you will brown the onions—how do you do that?”
Asking questions and getting answers from a participant is a very versatile tool. It can be done without many resources. In addition, you are not tied to a specific place, and you can talk about both past events and future plans.
However, it can happen that you hardly focus on actual experiences and instead talk about events in the abstract. Observations are therefore a good complement to asking questions and listening.
Observing
Only listening to people might not be the best way to understand what they are doing. Just like a picture is worth a thousand words, it is often helpful to ask participants to show what they talk about and to demonstrate how they work. Frequently, it is also easier for participant and researcher alike.
As you observe, you can notice things your participants would never consider to mentioning, because they’re second nature to them: The tools they use, how they apply these tools, and which problems they meet. But you can observe it. You also can learn about the context of their work, like means of communicating with colleagues or cues in the environment that point out problems—for example quick fixes on devices using tape and cardboard, or added instructions on machines.
It is not necessary to have observation as a separate step in the research process. It is best to interweave observation with asking questions and listening. For example, you can ask for a demonstration instead of a description.
If the participant tells you:
“So, as I have the recipe opened here, and read through the list of things I need, I would now start getting out the ingredients”
you could suggest: “Great—if it’s fine with you, let’s actually do that!”
Think of yourself as the participant’s apprentice. The participant is the expert who can teach you some of their skills. This means that understanding the participant by observing is not a passive process. Like an apprentice, you can and should ask questions.
You can ask about reasons, for example
“You did measure the weight of the flour on the scale, but the for the water you just used a cup. Why?”
Or ask about things you notice in the environment, for example:
“Are there certain things you do at specific places?”
Teaching an apprentice is not a theoretical or artificially set-up process: The tasks you observe should be tasks that the participant is actually doing (and not something set up for you).
If the participant asks you “What should I do now?”, you can reply with “What would you do if I would not be here?”
Of course, what you observe should also be relevant to your interests. The conversation could continue in this way:
Participant: “I would either start to make this stir-fry vegetables, or actually, only heat something up for lunch and rather make some apple crumble for dessert”
Researcher: “If you don’t have a preference, I would be curious to see how you make the apple crumble—I have not seen how people make dessert in our research, yet!”
From time to time, you might observe actions that seem wrong or at least not optimal: People might seem to ignore a feature that could make their work much more efficient, or they just never use a product that you focus your research interests on. Remain curious and don’t be judgmental. If you start judging and even possibly “correcting” their practices, you close yourself off to the reasons for the participant’s actions. Also, your participant would stop being open about showing you how they work.
Participants are experts in their work and have a reason for what they do. Maybe they do not want to be more effective because it would mean that their superiors would increase expectations, leaving no wiggle room for everyday contingencies. Maybe they routinely prevent situations from happening where they would need a certain technological solution and thus have no need for it.
Co-documenting
You can also document the work with the participant directly. I call this co-documenting because both you and the participant document some aspect of the participant’s life directly through drawing and writing. This can be as simple as asking the participant: “Draw a floor plan of your kitchen. Please highlight what is important for your work and write why!”
Here are examples of co-documenting results. Most of them are based on a template that guides the participant. To document the context of the participant, you can use a social space map as shown in the following figure. The participant is in the center, and they add who is relevant for them. Many participants do not limit themselves to people and might add institutions, roles, or technologies that are also important to them.
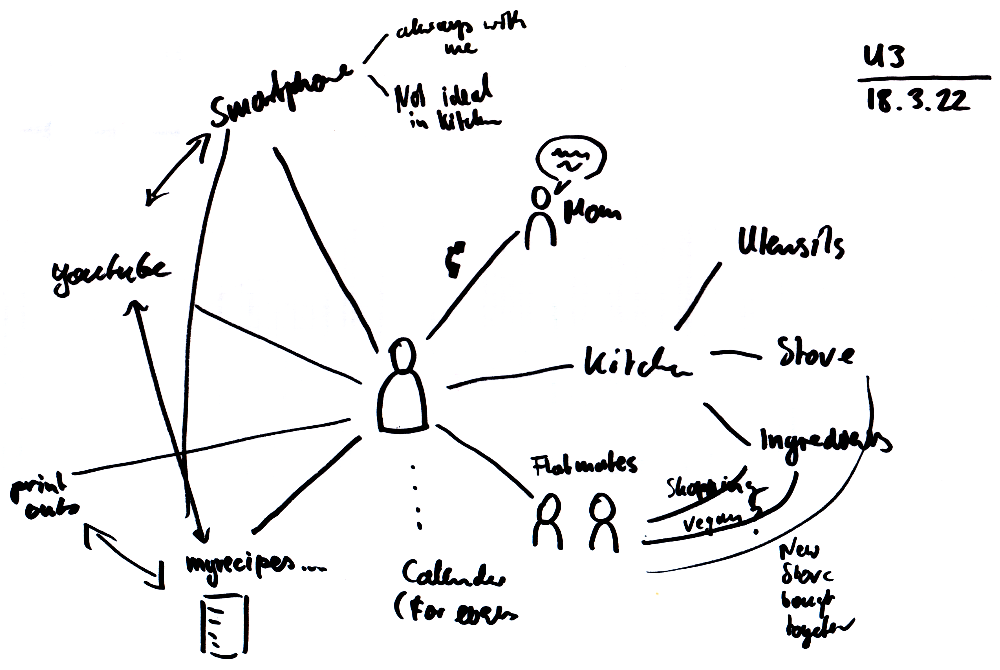
The timeline-diagram in the next figure is great for getting an overview of which parts of a longer process participants like and dislike.
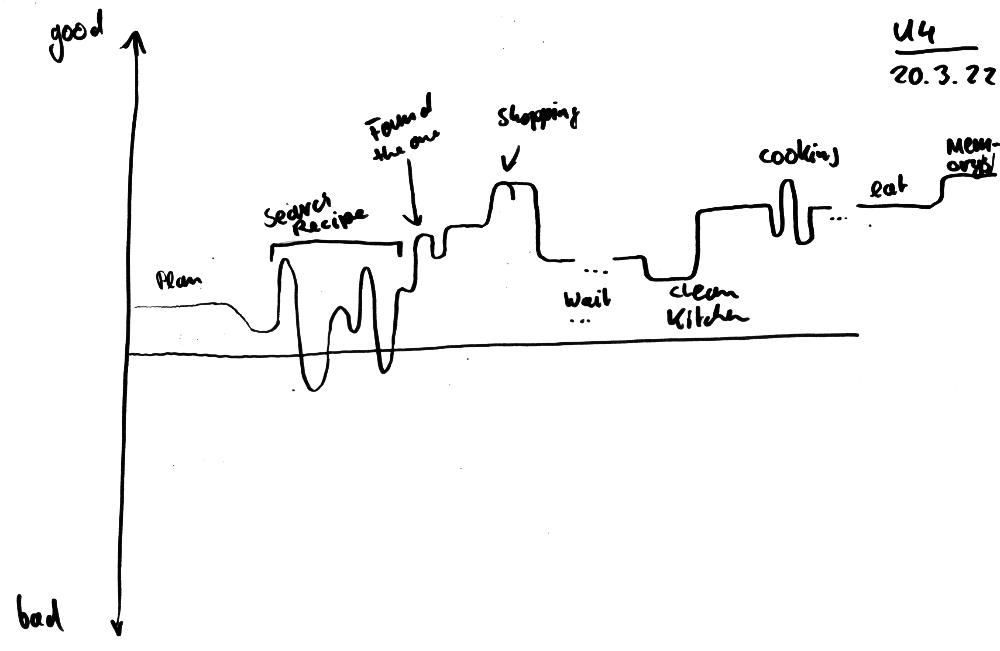
The timeline-diagram usually covers a longer period of time from a bird’s eye view. Often, you also want to know details about a process. To do this, you can use a recipe-like list of steps, as shown in the next figure:
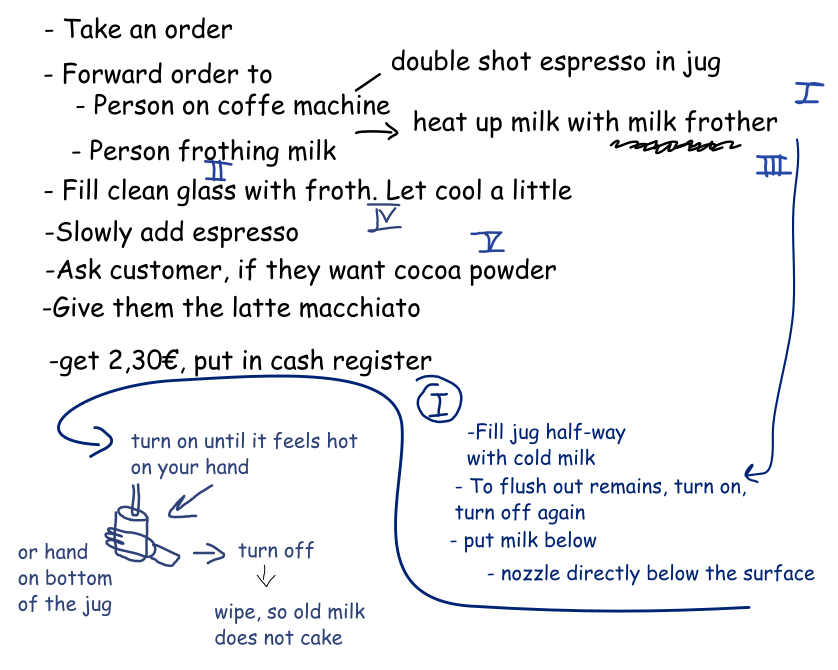
If you have the documentation in front of you and the participant, you can easily improve as you create it. You as a researcher, can refer to the documentation and ask for elaboration (“Is this the cupboard where you keep the ingredients?”).
The fact that researcher and participant both need to understand the documentation is a check against unclear terms, vague references, and sloppy handwriting. This makes the results accessible and useful.
A situation in which this is relevant could happen like this:
Researcher: “The line here seems to indicate that you were very happy at the beginning…”
Participant: “Yes, the recipe just looked awesome, I really wanted to try it”
Researcher: “Can you write this in the diagram, so I can understand it later?”
Participant: [Writes as comment in the diagram] “Recipe looks awesome!”
Who does the drawing and writing depends on what is more convenient and provides more interesting data. When researching workflows, I write the documentation as a researcher, because the participant should be able to demonstrate their tasks directly, which is difficult when you have to constantly switch between demonstrating and writing. When the participants document a project on a timeline, they draw it directly, and I only ask questions.
For some participants, documenting their work by drawing and writing can be a bit unusual. It can be helpful to show a simple example of what the result of a co-documentation. The example can also reduce anxiety in drawing related tasks—some people assume they need to produce a work of art. Showing that a rough sketch is okay will help them to get started.
Tip: Try creating some diagrams about your work to get a feel for it. Select an activity and choose a diagram to document that activity. Review the result: what could it tell another person about that activity? What does it not tell? Try another diagram type for the same activity: where do both diagrams convey the same information? Where do they differ?
It can be easier for the participant if you provide a template instead of a blank page: It provides a basic structure. The template should have fields for name, date, title, and space for the participant’s diagram. Sometimes, I also print a small example in a corner of the template. The following figure is an example for a template that I use for timeline diagrams.
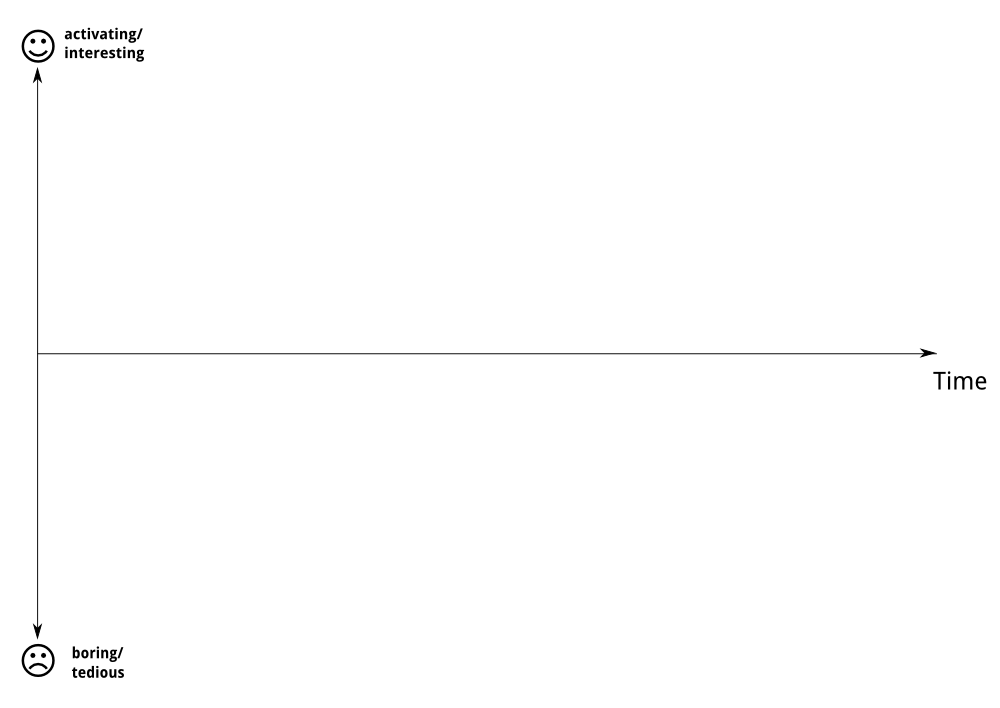
Co-documentation works well in combination with interviewing and observation: You can co-document workflows in combination with observing the workflows, or you can transition from interviewing to co-documenting a specific aspect (“That is interesting! I would like to remember it clearly later on, so I would like to write the steps down with you”) later, you can use the documentation to refer back to it (“You wrote… How does relate to…”) and add further details.
Co-documenting via lists, diagrams, and drawings may seem unusual at first. But they produce very useful and easy-to-interpret data by having the researcher and the participant work together. It can empower the participants that they do not only actively show and tell but also take part in recording.
Ways to capture data
Without recording data, you need to rely on memorizing what you saw and heard. As there is a lot to learn from participants, it makes sense to support your memory by capturing data in writing, photography and audio recordings. What you record is strongly connected to how you engage with the participant: A conversation lends itself to notes and audio recording, the work process to sketches, diagrams and maybe even short film clips. However, there is not a 1:1 match of a way to learn from participants and ways to record data: Sometimes a verbal description is helpful for an action focused activity, some people might record a conversation in a more diagram-like form to see central objects and conflicts.
If you have a research partner with you, it is a common division of labor that the research partner focuses on the recording. However, if needed, they can ask for clarifications as they may notice gaps in the data they record.
Even if you have a research partner taking care of the recording, you should be familiar with the equipment. It may happen that they are late or get sick, so you need to record the data yourself. If you have the opportunity to work with an experienced researcher, you could also take on the role of research partner and focus on recording.
Before you take photos or make an audio recording, ask the participant if they are okay with this.
Notes and sketches
While you observe or listen to the participant, you should take brief notes. It’s a bit like taking notes at school or university: you go into the gist of what’s being said in as much detail as possible, but you don’t write down the exact words (unless you personally find a particular phrase important). One utterance or observation concerning one topic goes in one line, bullet-point style.
When you’re looking down at your notes and are thinking about what to write, listening and observing don’t work well. Try to keep it as unobtrusive as possible. If you don’t care too much about your handwriting, you can write notes without much looking at the paper except for some occasional glances. When you do the meeting remotely you can do notes by handwriting, too, or use your computer. Just check for keyboard noises—they can be annoying, even if you use a microphone.
Taking notes alongside other activities can be challenging. That’s why it’s good if you have a co-researcher who can help you: One person can ask questions and guide through the research, the other person takes notes. Both observe and listen.
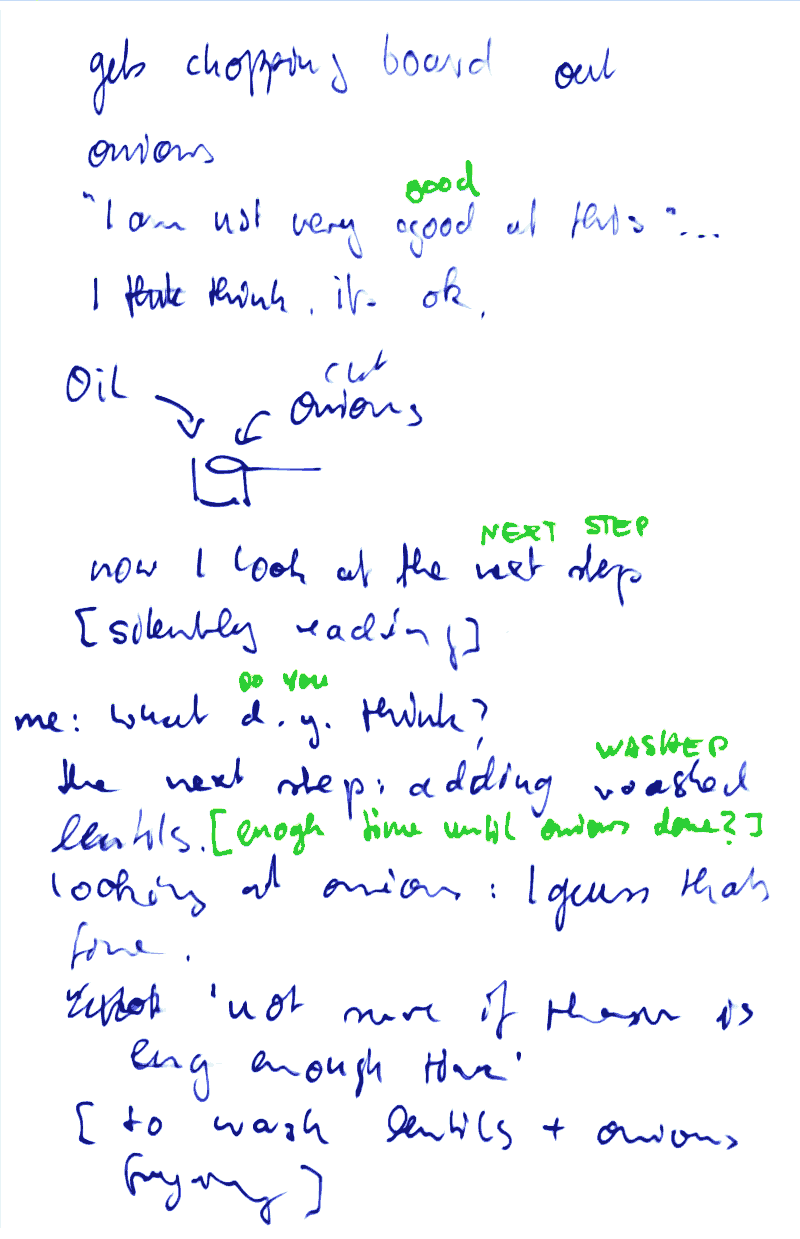
If you record audio in parallel, you can be more relaxed when writing what was said. However, you still need to take notes to record what you observed. Participants will also point to things and refer to them as “it” and “that”; without notes it can be difficult to reconstruct what the participant was talking about. In the previous example notes, I used little sketches to record what the participant was doing.
When taking notes in research, I often write about 1 page every 15 minutes. That’s why notes of a typical session won’t fit a single page or on the margins of your cheat sheet.
After data collection, you complete, transcribe, and analyze your notes. Between gathering the data and reviewing your notes, it is easy to forget the context.
For example, if you observe that someone tastes a bit of their dish and then adds a small amount of sugar, you might just write “sugar”. It could make perfect sense at the moment you write it, since you are watching what is going on, and you know what happened before and after. But without this implicit knowledge of the situation, the line “sugar” does make little sense. Instead, write something like “Tastes → Adds a bit of sugar”. It will help you a lot later when you read your notes.
Your observations will be visual and related to processes. A good way to support your memory of observations is to create sketches or small process diagrams.
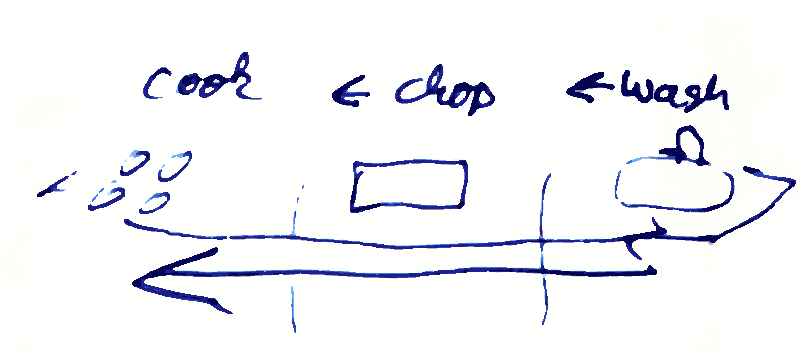
It is not important that your sketches look realistic. Realism is better achieved by cameras. Take advantage of the fact that sketches are different from photos: Enlarge what is relevant, leave out what is irrelevant and make annotations with arrows and notes on what was happening.
Taking photos
Taking photos is easy and can capture a lot of information. For example, you can photograph the participant’s kitchen to aid your memory. Later, you can go back to the photo when you read your notes. Where was their fridge, where was the stove? Where did they put used utensils and cutting boards?
You can also photograph screens of computers and gadgets if you have the participant’s consent to do this. A software-based screenshot might, in theory, be superior—but if the user does not know how to take a screenshot, a camera is a handy way to capture the screen.
You should be able to take photos with your camera or phone quickly and reliably. Use a device you know. The only setting that I use is the exposure compensation. This function is useful when the automatic setting for exposure fails you and an important part of the image is totally dark or disappears in light. Exposure compensation allows adjusting for that.
Recording audio
I recommend using audio recordings—it is a useful complement to your notes. Audio recording allows you to listen to what was said in the research session.
Audio recordings are not a perfect capture of everything that happened: If the participant points to an ingredient or utensil and refers to “this”, the recording is not much of help. People use such expressions a lot when they talk about activities, so you need your notes to complement the audio.
Photos and audio records complement notes and sketches well. They are, however, not superior to manual recordings: They are different, and you can use that difference to combine their strengths.
Assure and encourage the participant
At the beginning of the research session, the participant may feel insecure. Most people do not have experience as research participants, so they might be concerned about doing something wrong or unhelpful. To make the participant feel comfortable, it is important to support the participant and show them that you are interested in their work and explanations.
Affirm that you listen
You ask questions that aim for descriptions and longer answers. This means, you listen to the participant most of the time. You probably have some intuitive reactions that signal that you are listening—like nodding or saying “yes” or “mm-mhh”. These are ways to ensure the participant that you are listening to what they are saying.
Asking follow-up questions also shows that you care about in what participants say and do. Follow-up questions can be about topics the participant mentioned or workflows that they demonstrated. You can also summarize what you heard and saw: “So, you said that…”. This allows you to check your understanding and show that you listened keenly—without judging what is being said.
Some participants may assume that you can not learn anything from them assuming you already know about their work. For example, if you are from the company that developed a product they use, they might assume that you know about everything they possibly could do with it. Even if you know the product well, you probably do not know how people use it in practice and what its limitations are in such situations. You can tell them: “Thanks, it can seem this way, but I only create a small part of (Product) development and I am not an expert on (whatever the product is used for). I think I can learn a lot about how (product) is actually used in the real world!”
Make a friendly impression through body language.
Probably, you would not make a bad impression anyway, but let’s go through it nevertheless: Don’t appear angry or stern by frowning and crossing arms and legs. Don’t look careless by leaning back and looking to the ceiling. During the interview, show reactions to what the participant says or does. If you take notes, looking at the participant is not possible all the time—but try to show that you are attentive when you can.
Be open to how the participant works and thinks
In user need research, you want to learn from participants. This is exciting as you have no way of knowing what you will learn. What you learn unexpectedly is often critical to developing your understanding of the participants and to recognizing potential risks and opportunities. However, it is not easy to be open to these experiences. Not knowing what you learn is unsettling. In our everyday lives, we often trade the openness for efficiency and predictable outcomes. To stay open to how the participant works and thinks is a skill that must be learned—but there are some basic principles that can be of great help: Asking open questions, not suggesting answers, and embracing the value of silence.
Ask open questions
Open questions are questions that do prompt longer, descriptive answers. You already read about open questions in the section on writing your research session questions. Open questions can be contrasted with closed questions, which have only a closed range of meaningful answers. Asking participants open questions will lead to concrete and descriptive answers and potentially lead to insights that you did not expect.
I’ll revisit the subject here because only a part of the questions you ask will be questions you wrote down previously. You will also come up with questions that are responding to what you hear or see when being with the participant. It often makes sense to ask these questions as open questions, too.
In order to be able to come up with open questions during the conversation, it can be helpful to have some easy-to-remember phrases that help to ask open questions:
- Starting your questions with “Can you tell me more about…” invites descriptive, longer answers: “Can you tell me more how cooking for a large family is like?”
- Asking “How”-Questions invites description or demonstration of activities: “How do you go about choosing recipes” or “How did you learn what ‘sautéing’ meant?”
These phrases are useful for asking open questions. There are also phrases you might want to avoid as they usually start closed questions.
When it comes to product development, it’s quite tempting to ask “would you…” questions, like “Would you like to bookmark recipes?” Such questions are problematic for two reasons:
- They ask the participant to make assumptions about their future, which is not very reliable.
- They often invite short answers like “yes” or “No”, like “Yes, bookmarks sound good.”
“Is” is another word that often leads to closed questions that are answered with “yes” or “no”: “Is it difficult to cook a risotto?”—“No, not really.”
Tip: Sometimes closed questions can be a stepping stone to asking open questions. “Would you like to bookmark recipes?” points to a relevant activity: About re-finding and organizing recipes. An open question based on this could be “How do you look up recipes again which you liked in the past?”
By using phrases like “Can you tell me more” or “How do you…” you can ask open questions in response to what participant says or does. While closed-ended questions are sometimes helpful, more often they are not. Rephrasing closed “Would you” and “Is…” questions can help you to get more interesting answers.
Do not suggest “right” or “wrong” answers or processes
A common concern of researchers is influencing the participants. One way to deal with this concern is to define how questions should be asked by giving a strict script.
But creating artificially constant conditions would cause you to lose the strengths of the methods described here: Being able to find out about new and unexpected things and gaining understanding of the how-and-why by reacting on the situation. Each participant and their context are different. You can accommodate this by adjusting the research to the context. This would not be possible if you would ask the same questions every time. Being able to react to situations is essential and a strength of the research method.
However, what I think is relevant, is to consider how your own assumptions and wishes can lead to suggesting favorable answers. Such influence in research takes different forms: “This is good, isn’t it?!” Is a very obvious influence, since it as it bluntly expresses what you think the answer should be: a “yes.”
There are also less obvious influences, for example by asking “Would you like a better version of this?”—who doesn’t want something better?! Again, the answer the participant is going to give is “yes”.
In addition to your questions, you could also suggest “right” ways of doing something with direct reactions. For example, if a participant says “I can’t read the recipes on the website, and there is no mobile view to make them readable”, it may be tempting to say: “No, there is!” if the participant did not notice the feature.
Remember, you want to find out what your participant is doing and why. Correcting the participant immediately rarely leads to new insights. Instead, you can simply ask “what do you do then?”, or, if talking about the function itself is important to you, you can ask “What is an example for a website that does it better?”
That being said, if you can clearly help the participant with a simple bit of information, explore the topic and share your knowledge immediately afterward —while not “correcting” the participant: “That was very helpful for me to learn! The team building the website will appreciate learning about such problems. What they assumed is that people trigger mobile view by…”
You may also be surprised or even annoyed by steps or actions in a workflow of the user that seem outright superfluous.
Participant: “When I want to share a recipe, I take a photo of the screen like this… and then I can forward the image in a chat”
You may think that this is pretty inefficient and be tempted to say “Why don’t you use the share-function or copy the web address?—that would be far more efficient!”
No one does inefficient actions because they are inefficient. Assume that the participant has a reason. Try to figure out what that reason might be.
Again, you could ask: “What’s the reason for you are doing it this way?”—and ask follow-up questions to further explore the issue. For example, they may prefer images because they show directly in chats and can easily be tapped to zoom in, whereas the original website would open in another app.
Don’t be afraid to react toward the participant and what they say or do. Adapting to the situation is essential in our research. But don’t judge the actions or answers of a participant. You are interested in the how and why of their work. When you judge what they are doing as right or wrong, questions that you could explore are cut off prematurely.
Silence feels strange, but it’s okay
Sometimes, the participant takes time to think before answering. Intuitively you might want to fill the silence to help the participant.
Researcher: “Can you tell me what happened after you put the pepper in the dish?”
(pause) “…was it okay?”Participant: “Yeah, I think-”
It is tempting to fill the silence with suggestions for the answer. But it can turn an open question (“can you describe…?”) into a closed question (“can you describe… was it…?”) or prevent the participant coming up with their answer on their own.
Try to tolerate the silence. Usually the participant answers within a few seconds. If you notice silence which you want to fill, count to three or five before probing further. Then, ask about the question rather than giving suggestions: “What makes the question hard to answer?” or “Can you tell me what you are thinking about?”
This way, you can help the participant to continue with elaborating on the question you are asking, even if it takes them some though to answer it.
Take a closer look
Early in the research session, you only have some basic knowledge about what the participants do. You know some terms and what they describe. Later, you try to learn how it all connects, understand what the participant thinks is relevant and why, and see and experience easily glossed-over implicit knowledge about activities and skills.
To learn more, you can probe with follow-up-questions, check your understanding, and ask for demonstrations.
Probing
When I learn something new, I often have the feeling that this is just the beginning of a larger topic. In this case, I can “probe” for further information.
You already know one way to do this: silence. Just as you might intuitively want to fill the silence, the participant may just step in and fill the silence with further information.
Participant: “Well, I found that recipe and I tried it once, but it was so-so”
(Short pause, researcher nods)Participant: “I don’t know what the problem was, I guess something about the timing. Everything was just mushy”
Alternatively, you can also repeat the most recent statement or words the participant has said.
Participant: “Well, I found that recipe and I tried it once, but it was so-so”
Researcher: “So-so?”
Participant:“I don’t know what the problem was, I guess something about the timing. Everything was just mushy.”
That way, you can help participants keep going without changing course by asking new questions.
If you want to know more about something specific, you can also ask directly: “Please tell me— What would you do if you had to wait?”
Asking directly can be useful if the participant has answered rather vaguely:
Participant: “Well, I try to get some more information and try to find out where it got stuck”
Researcher: “Could you describe to me how you would do that?”
If you gather your data by observing or drawing diagrams with the participant, direct questions are very useful for exploring the work.
Researcher: “You added pepper without first tasting or checking the recipe—how did you know it was needed?”
Or, when co-documenting with the participant in a diagram:
Researcher: “This graph seems to indicate that you were in a pretty good mood here. Could you explain a little bit why you seem less happy here [Points]?”
These methods allow you to gain additional information and show the participant that you are listening and observing carefully. Following up on observations and information is important for learning. However, sometimes you want to check your understanding. Even if everything makes sense to you, it is often good to check if your understanding makes sense to them.
Check your understanding
To check my understanding, I often go back to what the participant talked about or showed me before. I tell them how I interpret a situation based on what I have learned from them and ask them if it makes sense to them. In this case, even closed (yes/no) questions are fine.
Researcher: “You said it looks good, now. Did you think the pasta is ready now…?”
Participant: “No, I meant the sauce. It looks good, just like on the picture in the recipe.”
There are several benefits of checking your understanding:
- Avoid confusion and misinterpreted research due to misunderstandings.
- Show that you care about the participant’s expertise.
- Encourage participants to continue and tell you more.
For checking, you need to refer to something that you want to verify. You often need to describe it to the participant:
Researcher: “So: If I wanted to cook something, would you first see what ingredients you have and then try to match a recipe?”
Participant: “Yes… I mean, somewhat. It matters. I don’t want things to go to waste.”
To refer to what you learned, use your notes as memory aid, and don’t be afraid to just point at things if you do not remember the correct term. The participant will tell you what the thing is called. For example, you could ask: “Can you tell me more about this does?” (points at a utensil)? Or when co-documenting: “Here (points to diagram) your motivation seemed to change quite quickly—can you tell me more about that?”
By checking your interpretations of the participant’s descriptions and activities, you can avoid misunderstandings and gain additional insights.
Ask for examples
When participants mention an activity or tool they use, ask them if you could observe the activity or tool in action. Seeing an example avoids misunderstandings and offers rich opportunities for further insights:
Participant: “…so I would just use the food processor for that.”
Researcher: “Can you show me how you do this?”
This avoids ambiguity as to what they meant by “use.” It is easiest for researcher and participant to look at it together.
You can also ask for examples to dig deeper into a topic. The participant may have mentioned a process before, and you can build upon this and ask to learn more about it:
Researcher: “You said you would look on YouTube how to cut this. Can you show me how you do that?”
Or, without asking for a demonstration:
Researcher: “…what would you expect to find?”
Asking for examples provides a natural way to show your interest, expand on topics, and to move from a conversation to an observation. Switching methods and topics in your research is important to figuring out what is relevant to you, and that what I will cover in the next section.
We have already built something, why not use it?!
When discussing project types in the first chapter, I wrote that user need research should be done early in projects. Often, however, people have already started designing something, such as a prototype or a concept document, and they will ask you if you can’t make this part of your research. You can, but some caveats apply.
When you bring up an idea or prototype, steer the conversation towards the effects on the participant’s work. Do not focus on whether they like it or whether they find it useful.
I introduce such ideas or prototypes by saying something like: “There are always a lot of ideas floating around. A colleague said they think about…” This reduces the risk of the participant assuming I am excited about the idea and wanting validation instead of learning from them.
Then, I show them the prototype or the idea. Sometimes it is working user interface, sometimes a competitor’s tool, sometimes just a few sketches or diagrams. But keep it simple—the gist of it should fit on one screen or printout, otherwise you will only create confusion.
After presenting the prototype or idea, focus your questions on how the participant expects it to affect their daily lives. You could ask: “How do you think would this fit into your work?” or “We do not know enough about your field of work, so we were wondering what the impact of such a product would be.” If the participant hesitates, it can be helpful to ask what other people might think: “What would your [peers/team/family…] think about using this?” This is sometimes easier to answer and can yield insights into the participant’s social environment.
The participant’s response will help you to learn about their motivations, activities, and problems. For example, they might tell you: “Yeah, this idea keeps coming up. But it will not be used. Just doing it by browsing takes time, but it is fun. I do not want to make recipe selection more efficient!” or they tell you “I currently use Google Docs for this and only mention people there. But I’m having a hard time keeping track of all the feedback I got, and I sometimes wish it would be more orderly” You can then explore the topics deeper and ask: “Can you show me how your process works in Google Docs?”
I also had people who directly dismissed or were indifferent to what I was showing. They could easily tell why. This is actually great, as it avoids wasting more time and money on an idea.
If you use prototypes or ideas in your research, it should be clear to your colleagues that you do this to learn more about the participant’s work. When people ask you to “evaluate the concept” or “test the prototype” they want to learn about the concept or prototype and should do a usability test instead.
Introducing existing ideas and prototypes can help you learn more about the participant and the context they work in. The results can inform you next steps in working on the prototype or idea. This can only work successfully when you and your colleagues agree that the focus is on learning about the participant, not the idea or the prototype itself.
Steer the course of research
A research session follows a structure: like in a film, you get to know the world and the protagonists before delving deeper into core issues. At the end you tie up loose ends and summarize what you learned. In order to navigate you and the participant smoothly from the beginning to the end of the research session, you need to provide guide topics and methods of the research session.
Changing between topics
During the research session, you cover different topics. You can set some topics in advance because you think they are important. In order to use your time efficiently and to learn about the topics that are relevant to you, you sometimes have to nudge the participant in the direction that is interests you.
You may want to switch between topics if:
- There is probably nothing more to be found out.
- You have covered enough and need to move to another topic before time runs out (If this happens, plan in more time in the future)
- The participant is focusing on a topic that is not in the focus of your research.
To switch between topics, you can express your interest in the next topic: “Can you tell me more about recipes that you use frequently?”
Before moving to the next topic, you can end the section by restating what you learned previously: “Let me briefly summarize: […]. So, what would also be interesting for me: You said you have recipes that you go back to again and again—can you tell me about this?”
Switching topics can be particularly useful when a participant gets carried away with a topic that is not relevant for you.: “…there is another topic is important to me: You said you have recipes that you go back to again and again—can you tell me about this?”
To make the change of topics less abrupt, and to show that you have been listening carefully, you can refer to a topic that has been mentioned, but not yet explored: “When drawing the diagram, you mentioned that you would ask your mom about cooking—what is it you ask her?” or “You mentioned that you sometimes prefer printed recipes on paper. What is useful about them?”
By switching the topic, you can cover the topics you need to know about and get your research back on track. But sometimes you do not want to switch the topic, but change the way you approach the topic.
Switch methods
Each method highlights different aspects of the participant’s motivations, activities, and problems. Therefore, it makes sense to transition between methods in your research. By using different methods on the same topic, you can gain new perspectives on it.
(Here is a possible switch from interview to observation)
Researcher: “You told me your general process of cooking a meal. Do you think we could cook something now, so I get to see it in practice?”In this case, you already have a description of the activity. By observing the process, you can gain a less abstract, more specific, and contextual look at it.
The methods you use on the same topic can be intertwined. For example, during the demonstration of the activity, the participant may add to their description: “[During cooking]I did not mention this before—I add some annotations to the recipes, in case I found some variant that I like or which is useful.”
Often, a new topic also brings with it a different method. Perhaps, you have heard about motivations of the participant and now would like to explore an activity: “You said you enjoy getting inspiration from browsing the web. Could you show me how you do that?”
Or you might want to talk in detail about something a participant just sketched in a diagram: “In this diagram, you mentioned that it is important to know what foods your kids like. Can you tell me more about what happens when it goes wrong?”
Again, the methods can be intertwined, so that information from one method is brought in when using another method: “Your child would be cranky if they do not like the food, and that easily messes up the schedule… let me add that to the diagram.” I then write “kids cranky:bad” in the diagram, so I can remember it.
Using different methods and switching between them may seem like additional work. However, it can make your job easier while improving the outcome —just like choosing the right tools in manual crafts.
Wrapping up a research session
Research sessions often take place in scheduled time slots. This means you can plan ahead and start to wrap up when you have about 20 minutes left, giving you enough time to tie up loose ends, summarize your understanding and then formally close the session.
Ending the session is like starting the session, but in reverse order. Starting meant moving from the predictable to new experiences; ending a session means moving from the new experiences and learning to a formal end.
As the research session draws to a close, you will want to tie up loose threads: Consider what you could not yet make sense of. Ask the participant for what you still don’t know. Don’t be afraid to express your lack of understanding.
Researcher: “There is one thing that I still do not understand: You mentioned you collect online recipes, but we have not talked about how you store them, to come back to the ones you like. How does this work?”
You may not be able to tie up all loose ends. Focus on what is important to you on and what seems to be particularly interesting about this participant: You may be wondering about how the participants organizes recipes in general, but this participant cooks for their family on a regular basis. You haven’t spoken to many participants about cooking for others, so you could focus on that aspect provided you can still learn more about organizing recipes from other participants.
A good way to guide towards the end of the session is to summarize what you have learned. This allows you to demonstrate what you and the participant have achieved together. It also gives the participant the opportunity to correct you if there are any misunderstandings.
Researcher: “I see that we approach the end of our meeting time. Thanks for giving me these insights into your work. Let me summarize what I learned from you: …”
After listening to what the participant has to say about your summary and taking notes of it, thank the participant for their time and for what you learned. I also let participants know that they can contact me if they have any questions about the research itself or the use of the data and give them my email address to contact me if needed. In my experience, it is rare for participants follow up, and when they do, it’s often with helpful hints or an example for something that they could not easily explain in the research session.
Note: Oh, before you go, something very important!
In some cases, the participant might start opening up a new and interesting topic just before the end of the research session. I don’t know why this happens. Maybe it is because they considered the topic to be important but were too polite to push for it themselves and hoped that the conversation would eventually get to the topic.
You could expand the session time. It is great to learn more, and it seems that the participant would like to let you know about this. However, it might also expand the time beyond what the participant gets incentivized for or what they actually planned. The best solution is usually to ask the participant openly.
After the research session
After gathering data, we need to take care that we can use the rich data in our later analysis. To get the most out of your data, you should complement your notes, sketches, and diagrams and add some information about the context of the data gathering to fill gaps and to help you to organize the data.
There are two ways to complement your data: From memory and from audio recordings and photos.
Complementing your data should be done as soon as possible after the research session. I recommend scheduling the data gathering so that you have some time right after the session to complement your data.
Debrief with your research partner—or alone
In the debriefing you mentally go through the research session again and note important insights or new questions. This is easier and more interesting when you are researching together with a partner since you can share your impressions with each other.
Debriefs can vary in length. I suggest scheduling at least 10 minutes, but for an interesting session, you can also fill 20 to 30 minutes.
There is no set structure for a debrief, but there are some points to pay attention to:
- What was surprising? What led you to develop your understanding?
- What was similar to previous research sessions? What matched your expectations?
- Which questions could you not answer? What are new questions that you have?
- What would you do in the next research session that builds upon these experiences?
Debriefs are helpful to get an initial structure to what you learned. They also provide closure and are a first preparation to both future research sessions with participants and analyzing the data. They have their strongest effects when done with a research partner. Aside from the advantages of exchanging and combining your experiences, they are also a great social experience that gives a sense of mutual achievement.
Complementing data from memory
Complementing your notes, sketches, and diagrams is important: Some data may make perfect sense to you now, but since memory fades, it does not make sense anymore later. Complement and clarify your data, so you can still comprehend them after your memories of the experience are not fresh anymore.
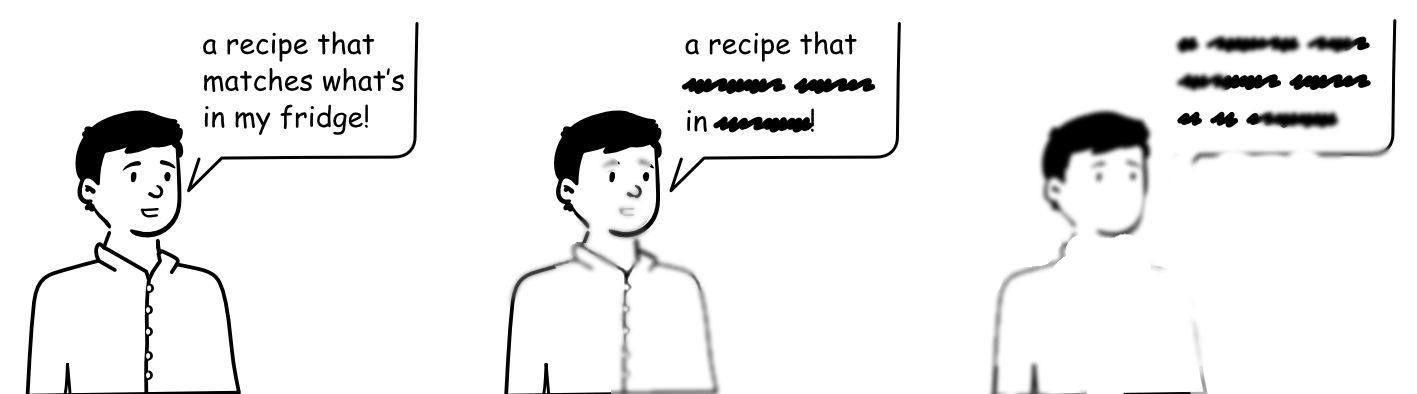
In my notes I have the line “No Milk.” This can mean many things, so I give some context here. I add to my notes: “Needs recipes with No milk because: milk = stomachache. Dairy free recipes: Vegan blogs as go-to-source”.
Similarly, if my writing is rather messy, I rewrite some words to ensure that I can later decipher what I wrote (See the following figure). I write and draw my complements in another color than the color of the original notes. When I wrote my notes during the interview with a blue pen, I use black for the complements or vice versa, since I like to keep track of what I did in which step of the process.
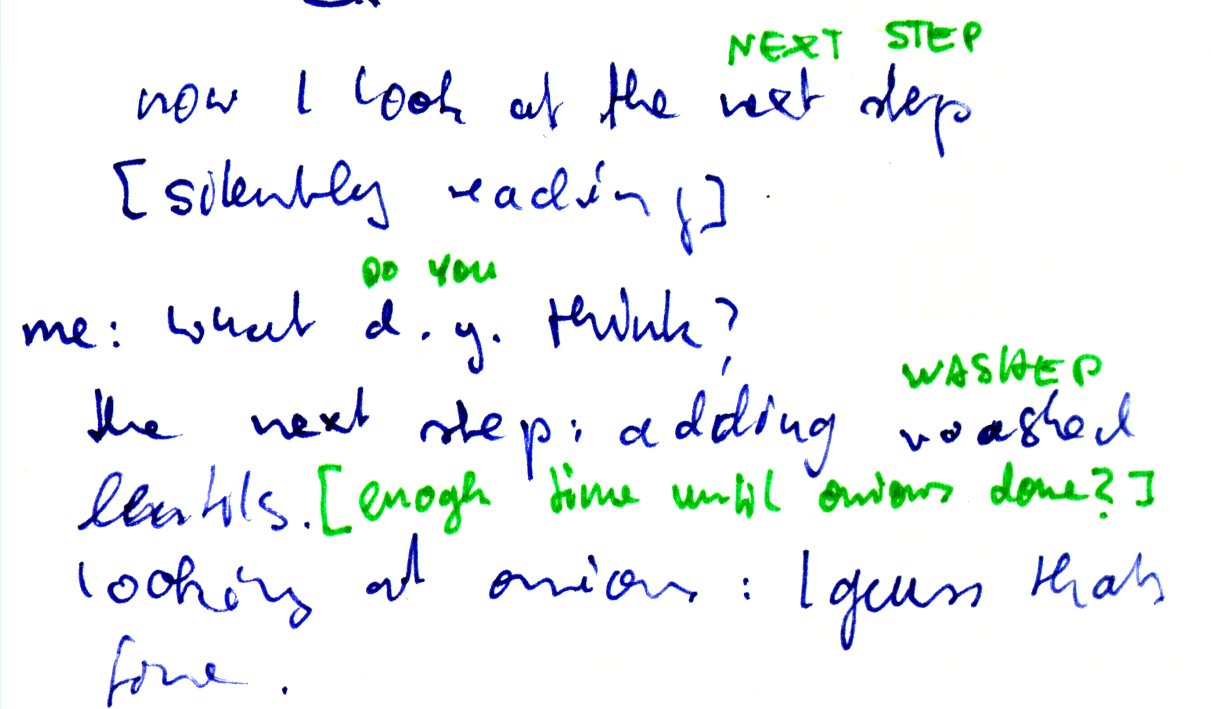
Using different colors is useful for another type of complement: Ideas or remarks in connection to your notes. When I go through the notes, I often have some ideas for a design or a question that I would like to explore in a future interview. I write them down in a third color, or I prefix the note with “IDEA:” or “QUESTION” to prevent myself from mixing my ideas with empirical data.
Transcribe notes
Because they are often written quickly, your notes will usually be rather incoherent: Single words, small sketches, and longer sentences will all be scattered on the paper.
![Clean transcript. Text: Person looking at the next step in the recipe, reads silently. I ask: What do you think?→ I now need to add the washed lentils. I wonder if I can do this before the onions are done. Looks at onions: I guess that’s fine[→she can make it in time]](images/03_dataGathering_transcribedNotes.png)
Tidy your data and transcribe the notes in a digital document. In your digital document, put one statement in each line.
Avoid tying together two separate statements on one line. This needs to be balanced with another need: Making sure that the data you put into one line is meaningful on its own and is not just a single word or a description free of any context and thus hard to set in relation to other data.
Here are notes that are too short and not meaningful on its own:
- making space
- shopping
If there is any way to add the actual context (from memory or by using other notes) these notes should be complemented with that context. This should help to learn why the person made space and why they went shopping. However, there can also be too much content in one line if it covers several topics at once.
- For cooking, you need free space in the kitchen, which is often occupied by things, so you need to move stuff around to get the space you need for chopping or peeling vegetables.
- If they can plan ahead, they go shopping on Saturdays to buy what they need for the coming week, including groceries for cooking. More often though, they go spontaneously, since the supermarket is nearby.
Too much content in each line makes it hard to analyze the data later.
In most cases, you can split lines that cover different observations or statements to multiple lines that still deliver enough content to be understood:
- Make free space in kitchen for cooking
- Chopping, Peeling needs free space.
- Go shopping on Saturdays for the coming week
- Spontaneous needs no large problem; supermarket nearby.
The notes from the research session and later added complements from my memory get the same formatting in my documents because they are all data I gathered by listening or observing the participant. But I take care that later added design ideas and research questions are still easily distinguishable from the actual data that I gathered in the research session.
Complement from audio recordings
If you made a recording of your research session, use it to complement and check data.
When the audio contains information which is not in the document or if it complements information that is already there, pause the playback and write the additional information in the document. The process is very similar to complementing your notes from memory.
The audio recording of participant is saying: “I’m kinda lazy, so I like to cook spontaneously and with the ingredients that are just there, you know?”
The notes say: “cook spontaneously”
So I add the information: “cook spontaneously. Use ingredients that are there. because ‘kinda lazy’”
If you need to save time, don’t listen to the full recording but go through your notes and see where they lack information. Jump to the parts of the audio that might complement these sections.
Pseudonymize your notes
When transcribing your notes, it is also a good point in time to pseudonymize them.
Pseudonymization means that you replace identifying information like names, places, or job titles with placeholders. So, the second user you talked to, “Abigail Miller”, might become P2 (a user code) or “Anna” (a pseudonym). This also depends on the participants’ wishes—some might want to choose a pseudonym or actually appear with the name they usually use. If there is nothing else specified, I use codes.
Aside from names, there might be other data that could identify the participant, for example names of places, institutions, or job titles. If they can identify the participant, replace them with more general placeholders: “Hannover” might become “A city in the north of Germany.”
Note: If you want to know more about pseudonymization, read “Anonymising interview data: challenges and compromise in practice” (2014) by Saunders, Kitzinger, and Kitzinger.
You can’t make pseudonymization absolutely safe. If your research involves people who need particular protection against identification, you also might want to use a more elaborate way of pseudonymization and data protection—explaining that is beyond the aims of the book and research with vulnerable people is not a good setting to get started with user need research in the first place, anyway.
Organize and archive your data
It should be easy to find out later which data was from which participant and how notes, sketches, diagrams, and possible audio recordings fit together.
Take care that all sheets of paper and files have the following:
- A participant code like P1 for the first, P2 for the second participant, etcetera. This way you can later trace back which data belongs together.
- The name of the project and the date. In your next or even a parallel project, you may have another “first” participant, and you don’t want to mix them up.
- The filenames (or the names of the folders they are in) should carry the participant code, project name and possibly the method too, which may lead to lengthy filenames like: LearnCooking_P3_diagram_shopping.png—“LearnCooking” being the project name, “P1” is the participant code, “diagram” is the method and “shopping” (by a client of a design) is the topic which is covered in the diagram.
- You should look for possible interconnections between different kinds of data. Maybe the participant mentioned their “messy” kitchen and you have a photo of it? Add a line in your transcript, referring to the photo. Or the participant talks about the problems of sending data to the print shop and the printing process was part of a workflow diagram you both created? Write a brief line in your notes and the diagram to connect both.
If you take these steps, you can still match project and participants later, and you don’t lose time or data because of some tangle.
As a result of these steps, you now have a transcript of your notes, diagrams, sketches, and photos with possible cross-referencing annotations, participant codes, and descriptive filenames.
Next steps
After a few research sessions you will get the hang of it: The field you research in feels more familiar, and you can focus more on details and nuances rather than on grasping what people talk about at all. The basic steps for the research sessions however, will remain the same.
After some sessions, it makes sense to start with analysis, as your results in the analysis can inform upcoming sessions. While it is good practice to weave research sessions and analysis into each other, it might not always be possible.
Summary
- Introduce yourself, explain how the research will be like and ask for consent.
- There are three types of gathering data: Listening, Observing and Co-Documenting.
- There are four ways of recording data: Actively with notes or sketching, passively with audio recordings and photos.
- Affirm that you listen to the participant: Nodding, saying “uhm” and referring back to what they told you. This shows that you care.
- Be open to how the participant works—don’t impose your own views.
- Delve into topics more deeply by probing, checking your understanding and asking for examples.
- Switch topics and methods to match your research interests.
- After the research session, plan for time to debrief, complementing notes and organizing data.
Analyzing what you learned
This chapter covers:
- Learning the basic principles for analyzing and making sense of the data
- Making sense of diagrams and sketches
- Analyzing your notes
Data analysis might not sound exciting: You have already learned a lot from your participants, so why not just go ahead and skip the data analysis?
While you certainly have some really useful insights already, the full potential of the data isn’t immediately apparent. Some useful insight become apparent only when previously separate data comes together.
The analysis also gives you the opportunity to reflect and critically evaluate your impressions: Sure, some ideas from your research sessions seem great, but do they make sense in the light of other data?
The previous reasons for analysis focused on you and your insights, but research for understanding potential users is often done in and for teams. When collaborating with others, you need to be able to show how you came to your insights.
Research is often a team effort. Researching together helps to get a mutual understanding about the research. Analyzing together also gives your co-researchers a deep understanding of the research, even though they may not have attended the research sessions themselves.
Tip: You do not need to be finished with learning from participants before you start analyzing the data! It can actually be very helpful to start analyzing as soon as you have collected data from three or four participants. Analyzing the data can help you find under-explored topics. You can then adjust your questions and cheat-sheet accordingly to learn more about these topics.
Data analysis helps you find patterns in your data and establish research-based principles for product development. It allows you to reflect on your ideas and discover non-obvious patterns. The analysis also creates the foundations to show that your insights have a solid foundation when communicating them. Analyzing with others allows teaching collaborators about the research by direct involvement in it.
Commonalities and contrasts
You make sense of the data by constructing repeating patterns and principles from it. A core activity here is to compare data to other data and ask how they might fit together or not. This will help you to spot patterns, point out variations, and guide your research.
This is similar to what you do intuitively when confronted with something new: you ask how it makes sense given what you already know. Let’s say you go through your data and you read, “I cook meals that my kids like, but I’d like a bit more variety” and read another note that says “I can’t just cook anything—I should use the groceries I have already bought.” You can compare the notes and see there is a commonality: Both seem to deal with constraints and choice.
But not everything fits together. Insights can also come from contrasts: The constraints in the preceding notes are different—kids’ preferences in one case, the groceries a person already has in the other. With that in mind, you could create a list of different types of constraints.
The commonalities and contrasts you construct can also guide your research: They help to find interesting questions both to learn from the participants and to analyze what you learned. You could try to figure out how the constraints play out in a broader context: Maybe people are starting to plan for the long-term to avoid constraints? Maybe the person who uses what they have actually takes pride in being good at avoiding waste and the limitation is more of a resource for them?
Understanding your data by interpreting commonalities and contrasts is a fundamental activity in analyzing data. It can lead to insights into patterns and differences in your data. It also can raise questions that require more data or different perspectives to get answers.
Doing the “right” analysis
In “Learning from Research Participants”, I wrote about the issue of influence in interviews and observations. I have said that researchers can’t take themselves out of the research and that their approach has an impact on the results—but also that this is a strength of the method and not something we can and should avoid.
Your impact on the results of the analysis is similar. Even if the same data is analyzed, different people will come to different conclusions. This is because the result of the analysis depends on the reasonable, but still individual and debatable, interpretation of the data: You might think that an utterance like, “I add some sugar here, even though the recipe does not say so,” should be best interpreted as “loves sweetness.” But it could be that this should be seen rather as an expression of “personal creativity” or “need to improve the recipe.” There is no right or wrong interpretation; but your analysis needs to be plausible, comprehensible and based on the data you collected.
Imagine, as a kid, you had a pile of bricks you wanted to build a house with. These bricks were like the not-yet-analyzed data you start with. When you did build a house from these bricks, there is no single “right” building. But neither was it an arbitrary process of connecting bricks randomly.
Building a house from bricks is like analyzing data. Just as there is not one correct house to build, there is no one correct analysis. But it is also not an arbitrary process: There are many, many ways to combine the bricks in some way, but only a few of these ways will result in something that can plausibly be called a house.
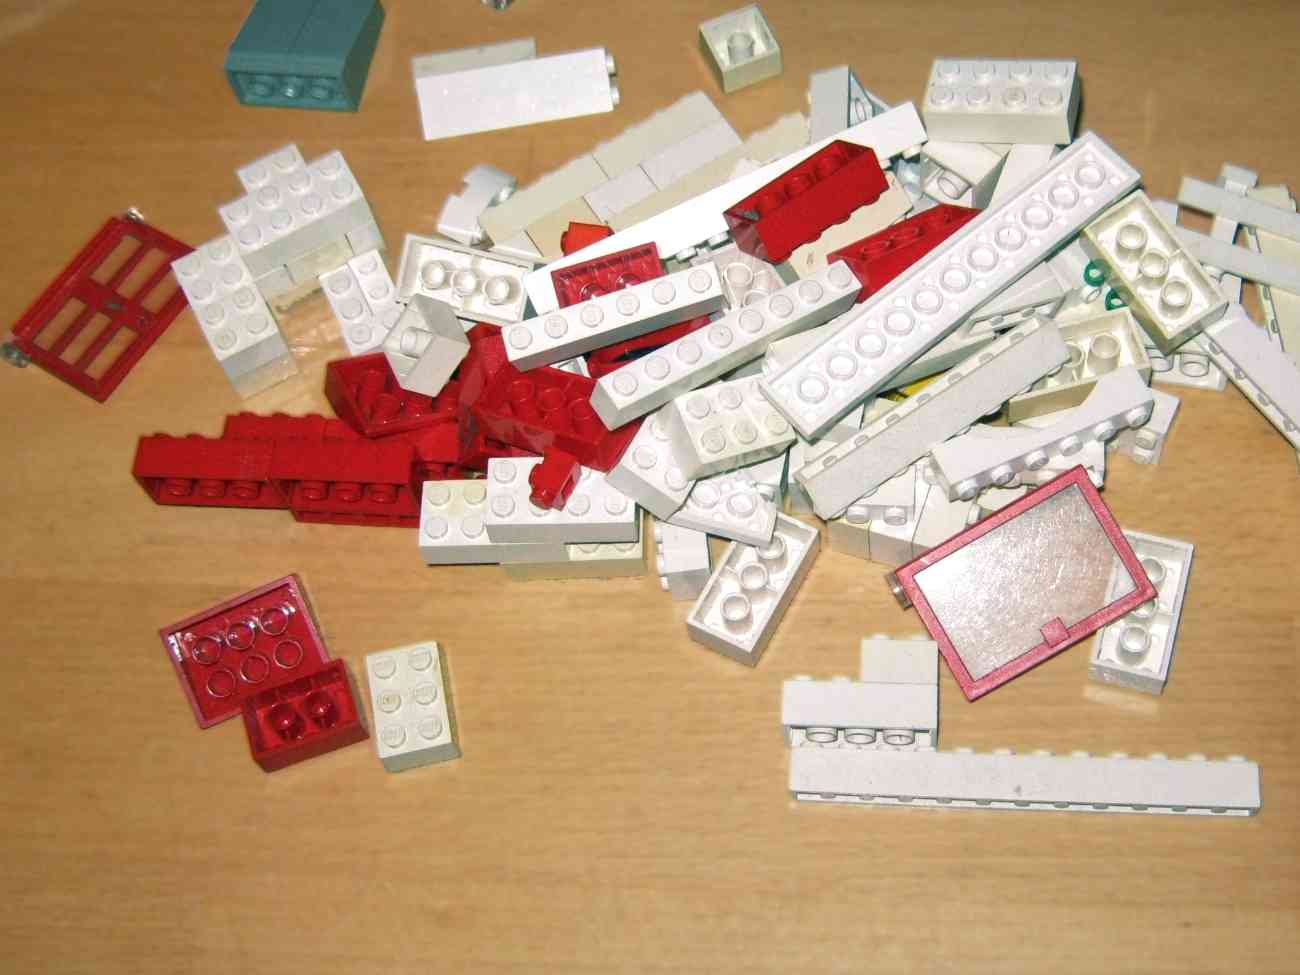
What the house will look like in the end is not certain from the outset. You will change designs, move walls, and sometimes try to use the same piece in different parts of the building,

Almost the same applies to your analysis. You will move walls and bricks but will adjust interpretations and organize your data into different structures. As with the bricks, there are many ways to structure the data, but only some of them will create something meaningful to you and others. This creation of a meaningful structure is not set at the start but is a process, just like building the house from bricks. You will try, fail, try again, think it is somewhat okay, find improvements to it and gradually move closer to a structure you are happy with.
A process for making sense of diagrams
In the chapter on co-documenting I introduced (co-) documenting via:
- Lists and flowcharts, for example, the steps required to prepare an espresso.
- Charts, for example, how the mood changes over the day.
- Maps of places, for example, where something is in a kitchen.
- Maps of relations, for example, which people helped you to learn to cook.
Now, we focus on how to analyze them and put them into an easy-to-grasp form. The process has three steps:
- Preparing diagrams
- Finding commonalities and contrasts
- Summarizing the diagrams in a diagram of your own.
Note: You can interweave both analyzing diagrams and analyzing your notes. Although I have described the methods of analysis in different sections of this book, you can use one to better make sense of the other.
Preparing diagrams
Annotate the diagrams with potential interpretations to prepare for analysis. For this, you can photocopy the diagrams and write on the copies.
Note: If you like to keep it digital, you can use any application that can add text over images, for example Inkscape.
If you are collaborating with others, it makes sense to distribute the initial annotations among the group. After that, everyone shares their annotations and others can ask questions or suggest additions or changes. In this way you will receive diverse input and a common understanding.
My example in this section are diagrams where people have drawn their process of cooking or baking and what made them feel good or bad about it.
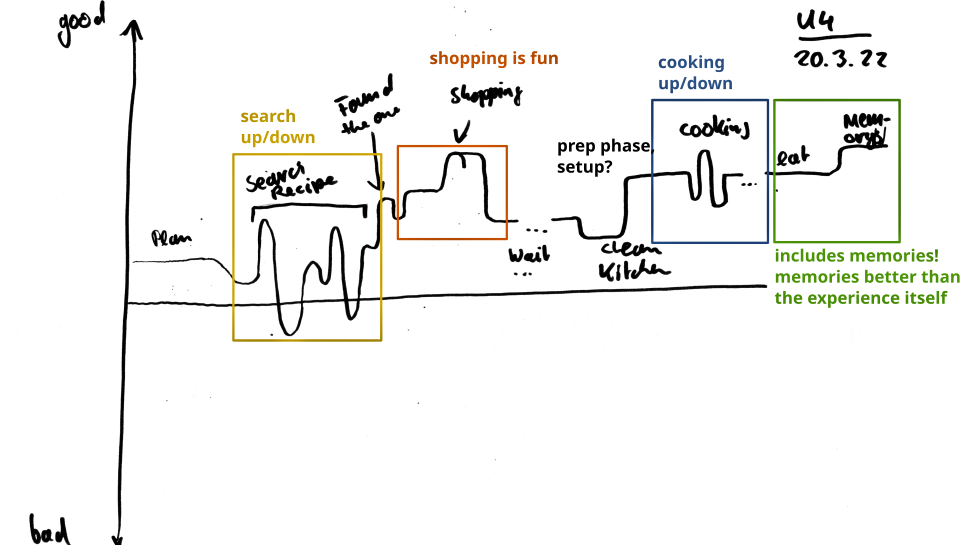
In this diagram, I made the following annotations:
- I highlight sections of the process with rectangles of different colors. In later steps I can see if these make sense in diagrams by other participants
- Early on, the participant was looking for recipes, which caused them ups and downs in quick succession. This is similar to what the participant experiences while cooking.
- Shopping is fun for our participant.
- There is an explicit gap between finding recipes and getting ingredients (I wonder if other participants will highlight something similar?).
- There is a setup phase before they started cooking (Again, will others have this, too?).
- Eating seems to be about as fun as cooking. The memories of the meal are what is positive (The explicit focus on memories is interesting!).
When you annotate multiple diagrams, you intuitively begin to compare diagrams with each other. I describe this in the next section, but in practice, both activities are intertwined.
Finding commonalities and contrasts
When you have thought of possible interpretations of the diagrams you have, you can compare them among each other. Do they show the same pattern or do they differ? If yes, where and why? When doing this, you can overthrow or update your initial interpretations and find common patterns as well as highlight interesting features.
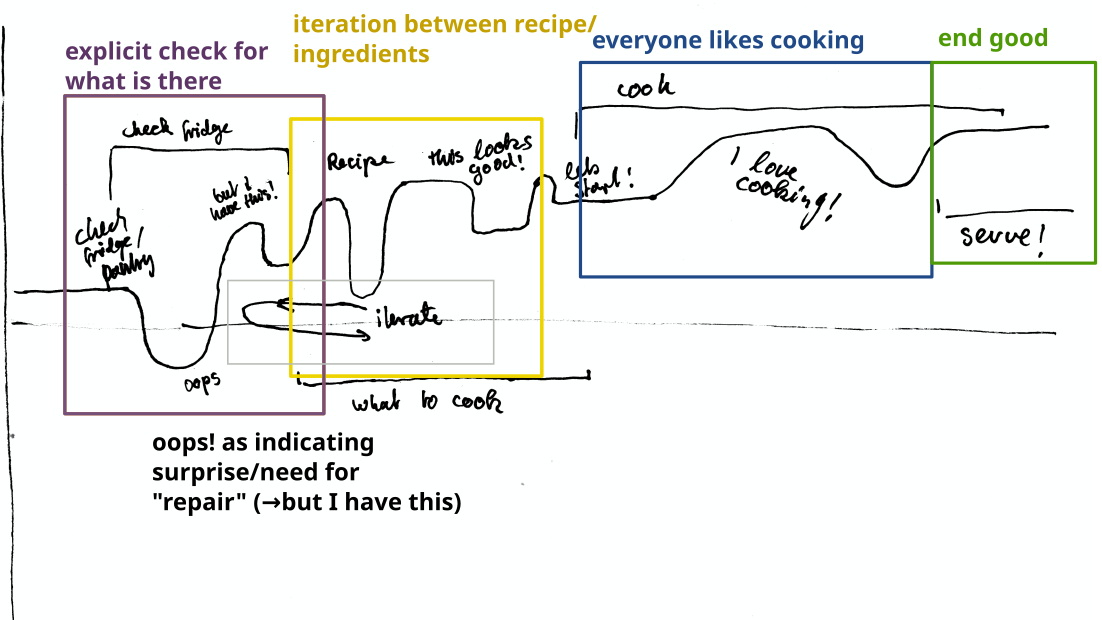
When comparing the diagram from the previous section to this the one here, there are similarities and differences:
- The participant here seems to base their decision on what ingredients they currently have at home. This also involves and iteration phase to figure out what to cook, similar to the initial iterations of the diagram in the previous section.
- The process of finding a meal to cook can have small successes and failures—the mood goes up and down. This is similar to “search a recipe” in the previous diagram.
- In both diagrams, cooking is a positive experience.
- Serving the food is the (positive) end of the process; the previous diagram actually ended with a focus on memories of the meal.
This also led to some questions I ask myself when looking at the few diagrams:
- Is the process of recipe selection usually described as iterative and trial and error? (Our two diagrams so far imply such a process)
- What is the last step for other participants? (Serving? Memories? Something else?)
- I am not sure about what happens during “cooking”. Maybe the diagrams are not the ideal way to get details there, but I am curious if there will be diagrams that tell me more.
This is just one comparison of several that would follow.
By constantly comparing what we learned from previous diagrams with additional diagrams, we learn about repeating patterns and possible variations. After comparing all the diagrams we currently have, it is time to summarize what we learned.
Summarize what you learned
You can summarize the results yourself in a diagram. It will look similar to the ones the participants drew. In this diagram, you will include insights that showed in several diagrams. Sometimes I also add data that I can’t necessarily confirm as repeating in the data, but that I find interesting.
Based on the diagrams used in the previous steps as well as diagrams from more participants, I created the following summary diagram:
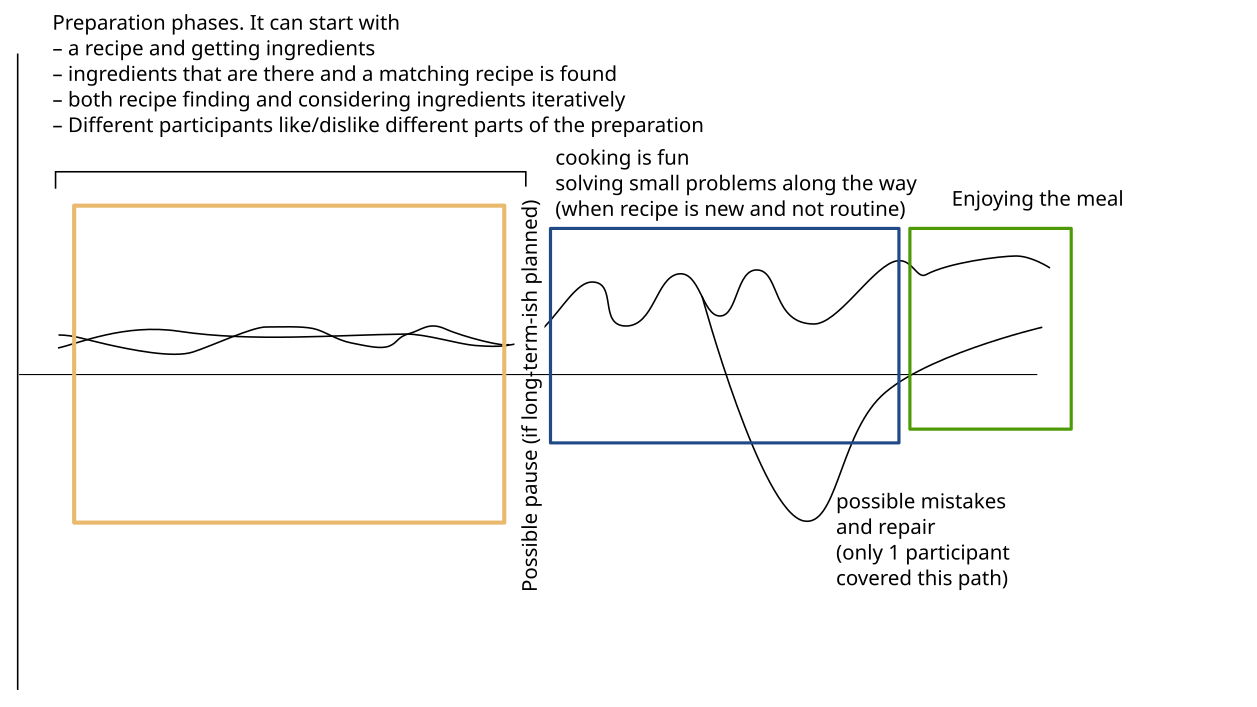
- I could not find a consistent pattern for the preparation: Some participants did choose the recipe first and then bought the ingredients they needed, other participants chose recipes for the ingredients they had at home.
- There was also no consistency in what they liked or disliked about the preparation, for example, some loved shopping, others disliked it.
- Some participants planned their cooking and prepared it a few days before cooking.
- All participants enjoyed cooking.
- The participants often drew the cooking process with a slightly wiggly line: There were usually little problems or uncertainties that participants needed to solve.
- One participant spoke about a case that went wrong. Although it was only mentioned by one participant, I found it interesting for two reasons: the inclusion showed that processes are not predetermined, and it also showed that errors are not a general error, but are fixed.
By creating a summary diagram, you can present your findings in a form that is quick to grasp and maintains a link to the original diagrams that our participants drew.
I mentioned previously, that you can intertwine analysis of diagrams and notes. In this section I covered diagrams; next I show how to make sense of research notes.
A process for making sense of notes
Your notes are data in written form, maybe with some occasional sketches. I will demonstrate a method to analyze your notes in-depth. In contrast to the methods for analyzing diagrams, this is more complex. However, it is a very powerful method that allows going beyond the data to create meaningful interpretations that can guide future design work.
Organize notes hierarchically
The basic unit for our analysis are the utterances or observations which are usually represented by a line in your transcript. For example, a line in your transcript could be: “I usually try a new recipe when I think its fun and have a reason to bake a cake, birthdays, or something like that.”
You organize these notes hierarchically and create groups that share a common theme. You give each group a title that states the theme of the underlying of data.
Sometimes you will have multiple related themes that form a common theme. In this case, it makes sense to make a group of groups with a title stating the overarching theme of this group of groups.
Here is a part of an analysis showing data organized in themes and sub-themes:
- Overarching theme: Finding inspiration/New Recipes
- Sub-theme: Stumble on content
- Data: Sometimes something baking-related pops up on YouTube
- Data: Online news sites sometimes have recipes
- …
- Sub-theme: Direct search, when there is a specific reason
- Data: “I wanted to bring a cake for a party of a friend, so I looked for something with chocolate (they like it)”
- Data: “After going vegan, I looked for variants of non-vegan food I liked”
- …
- Sub-Theme: Recommendations from friends
- …
- Sub-theme: Stumble on content
Such a hierarchical analysis could be done in two ways:
- Top-Down: You name the groups and write the titles first, and then sort pieces of data into the groups.
- Bottom-Up: You start by grouping data that appears to have a similar theme, and then give the group a comprehensive title which states the topic shared by the underlying data.
In this book, I will start by describing how to do the analysis bottom-up to develop themes based on data. Later, when you have created some themes, you can use both methods: You develop themes from data, but you also check where and how data matches with already developed themes.
Themes can grow over time as you add notes to the theme. Consider this group:
- Sub-theme: Finding recipes
- Data: Sometimes, something baking-related pops up on YouTube
- Data: Online news sites sometimes have recipes
When I have this note: “I wanted to look up how much lentils go in the soup and while searching for the recipe, I saw a great photo of a chocolate nut cake”, it makes sense to group it under the “Finding recipes”-theme, too.
This is just a simple overview of the process. In practice, you will also spend time sifting through data, rewriting theme titles and may need to take a step back to find a new way to make sense of your data.
Create meaningful groups
I already talked about grouping notes by themes they have in common. A theme is a statement that describes an insight about the notes in its group. It should be meaningful on its own. In this section, I discuss what this means practice and how you can spot themes that need improvement.
One way to group notes and to derive a theme would be to go through the notes and see which utterances and observations mention the same thing or give the same assessment.
Let’s say, you collected this data in our research:
- I just search recipes again online
- My recipes are in this stack of paper.
- When I find a good recipe, I print it and put in a section in this folder.
- I bookmark recipes in my browser.
If you put the notes which mention the same things in the same group, you get these two groups:
- Paper recipes
- My recipes are in this stack of paper.
- When I find a good recipe, I print it and put in a section in this folder.
- Digital Recipes
- I bookmark recipes in my browser.
- I just search recipes again online.
Organizing the notes by this same things mentioned-method would help us find notes concerned with a specific thing or assessment: If you want to see everything that related to recipes on paper, you can go through the notes in one group; If you would like to know about digital recipes, you could look it up in the other group.
However, organizing by the “same things mentioned”-method has its weaknesses: A theme named “digital recipes” only communicates that the underlying notes are somehow related to digital recipes. You still need to go through the underlying notes to find out what participants did with their digital recipes, what motivates them or which problems they face.
The names of themes created by organizing by the same things mentioned-method are just labels for the content and have no meaning on their own: “digital recipes” does not tell you anything interesting itself. However, you can create themes that stand on their own if you created them based on the insights you can draw from the notes in the group.
If you use the same notes but organize them based on insights, it might look like this:
- Theme: Avoid active organization
- Data: I just search recipes again online
- Data: My recipes are in this stack of paper.
- Theme: Active organization
- Data: I bookmark recipes in my browser
- Data: When I find a good recipe, I print it and put in a section in this folder.
If you organize notes by themes based on insights about the participants and summarize those insights in the group’s titles, the title is a useful piece of information in itself, like “(Participants) avoided active organization”: The theme is not just useful for accessing the notes in it but an empirically-based principle can be considered when designing.
When designing, a theme based on an insight such as “Cooking is self-expression” can inspire the implementation of functions to present photos of meals, integration into social media and honing one’s skills. The insight that “people often have unique constraints to what they can or want to eat” may lead creating a feature that allows to filter recipes for according to different criteria. The app also would not teach vegetarians skills like deboning chickens, and may provide cues on how to alter recipes to meet individual requirements. If you have a new idea you can ask: “Does this idea follow what is stated in the group titles? Does it violate them?”.
Grouping your notes based on insights about your participants provides great benefits. But it can be difficult and may not be possible for all your data. Therefore, creating groups using the same-things-mentioned method is still useful. These groups may still evolve to insight-based themes. Usually, I have some “same-things-mentioned”-groups in the beginning and far fewer at the end—but my analysis will be a mixture of both styles.
Prepare your notes for analysis
When you create groups of data, it is good to know whether the theme of the group is relevant to several participants or only relates to one participant. To be able to check this, you should provide each note (=line in the transcript) with a participant code. You have already used this code in the section on archiving your data to indicate which participant the recorded data belongs to. A participant code works like a pseudonym: You identify the participant not by the name they usually use, but by a substitute identifier. I use neutral number codes: The first person I did a research session with is P1, the second is P2, etcetera.
You simply add the participant code at the end or beginning of each line. It is not the most exciting work, but it is done quickly: Copy the current code (like “P1”) to the computer’s clipboard (using the keyboard shortcut Ctrl+C), place the cursor with the arrow keys and the end/home keys on your keyboard and paste the code (Ctrl+V).
Annotate your notes
After you added your participant codes, you can start to reviewing and annotating your notes to find possible interpretations, themes, and meanings in the observations and utterances. This will help you to familiarize yourself with the data.
Annotations can be complete sentences or short lists. Usually, they concern a line in the transcript, but you can also comment on whole sections or just at individual words.
As an example, here are annotations I added to two lines in my notes:
- “I don’t know how to make a sponge mixture” (she buys it ready-made) Note: Use of prepared/buy-able ingredients; possible group: “Externalization”
- “I rather add some more oil, here, this is not enough” Note: Expanding original recipe; expression of taste?; correction?
The annotations should be easy to distinguish from data you got directly from the observation or the participant’s answers.
You can print out your transcript with wide margins and write your comments in the margins. With pen and paper, you can quickly jot down your thoughts, circling and connecting interesting parts with lines. It will look messy, which is no problem, since your annotations are primarily intended for familiarizing yourself with the data, not for creating publishable comments on data.
If you prefer to work on the computer, you can annotate your data using a word processor with a comment function. Open your transcript, select the text you want to annotate, then click the “comment” button or menu entry. If you don’t use the comment function, but plain text, mark your comments by prefixing them with something like “COMMENT:” or “ANNOTATION:”
Annotating your data is a creative process. When in doubt, whether an annotation is relevant or not: choose to write it. It might be useful later. Because you keep data and comments distinct, you can always throw comments out. The goal is not to come up with great annotations, but to engage with the data and to find possible ways to interpret it.
Decide whether data should be held by lines or sticky notes
After annotating your data, you should decide which media you want to use for your analysis:
- In a word processor, where lines are the basic units of data
- Using analog or digital sticky notes that represent the basic units of data
The analysis methods described here can be used in both media. However, each media has different strengths.
Analysis in a word processor is lightweight: Any word processor will do the job. However, it does not lend itself very well to collaboration: Even when your software allows for collaborative editing, the process is a bit cumbersome. When it comes to collaboration, sticky notes shine: It is a very direct and intuitive process to move data around. This is especially true for using physical rather than digital sticky notes.
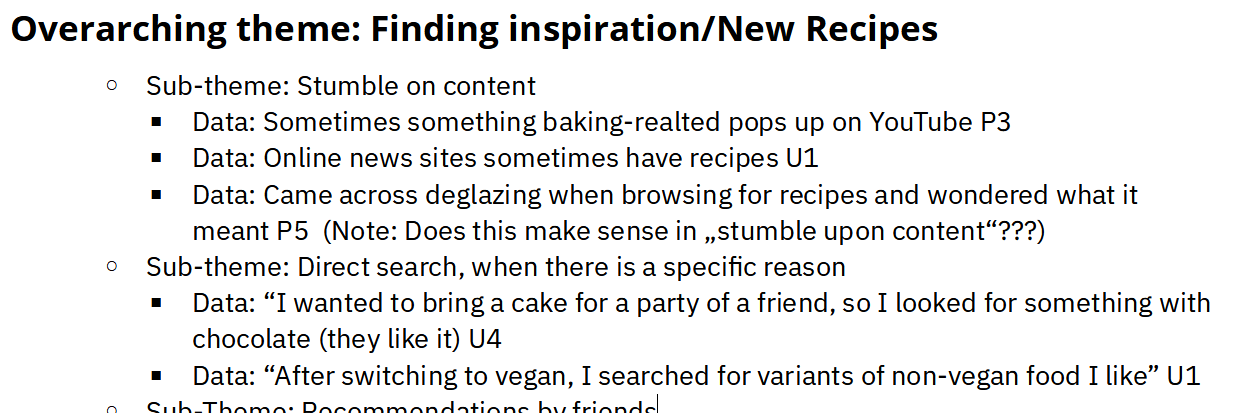
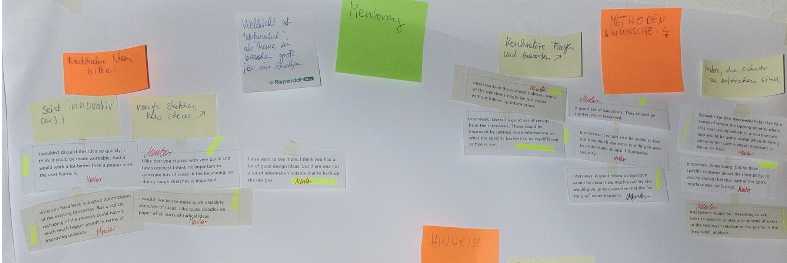
Note: There are also applications for qualitative data analysis. I do not discuss them here as they are often expensive and thus present a barrier for beginners.
The approach I discuss here is based on moving and clustering notes under themes. Most qualitative data analysis applications do not reorganize data and move it around, but tag sections in the original data.
The advantage is that you can more easily consider the data in its original context, and that you can retrieve data based on complex criteria like “all data tagged with cooking and failure” However, this also means that tagging and retrieval are separate actions which can make it hard for beginners to develop their skills.
My suggestion is starting with the grouping approach I discuss here. After you gained some experience, check out some qualitative analysis applications and see if their approach suits you.
Regardless of how you analyze, you will do similar activities: You need to get your data in an appropriate format, you need to know how to cluster data in groups, and you need to give the groups meaningful titles. In the next sections, I describe how you can do these basic activities in a word processor or using sticky notes.
Analysis in a word processor
To get your data in a suitable format for analysis using a word processor, I suggest the following steps:
- Create a new document
- Paste your transcript into this document
- Insert a page break before the transcript to separate ungrouped data from your (upcoming) thematically grouped data.
In a word processor, you group your data by moving lines close to each other. You can put them in a bulleted list for this. You can rearrange lines using copy-and-paste or drag-and-drop.
To name groups of notes, write a heading above the group. Create a hierarchy by using different paragraph styles—bigger headings for overarching themes-of-themes, smaller headings for themes. If you use paragraph styles to format your headings, you can use the word processor’s navigation tool jump to groups.
Analysis via sticky notes
For getting your data in a suitable format for sticky notes, you need to print out your notes. I describe one way to do this in the tip below.
To create sticky note groups, you simply move sticky notes closer together. This is great for expressing varying degrees of certainty. When you are confident in a group you can arrange the notes in clear rows or lines, while sticky notes you are not yet sure about might just be nearby, but not yet in the cluster.
For group titles, use sticky notes of a different color—write your group titles on sticky notes and add them to the group. Color-coding by hierarchy can be helpful: if you print your data points on white paper, you can use yellow sticky notes for group titles and pink ones for titles of a group of groups.
Tip: Print data for analyzing on sticky notes
If you want to do your analysis on paper notes, you need to print them. Here is the setup I use:
- Create a table in a word processor with 2 columns and many rows on an A4 or Letter-sized page. Each table cell will be a note.
- In the table settings…
- …switch off “Allow row to break across pages”, so that one note/table cell will not be split between pages.
- … choose a decent padding around each cell, about 0.5 cm
- Choose a font size of 12-14pt: It must be legible from an arm’s length.
- Copy/paste all your data (line by line) from the transcript into the cells.
Then, you print it out and cut out the cells. The only thing missing is actually being able to stick the notes on the wall. You can use restickable glue or tape, though most of the time I use plain masking tape.
After annotating your notes and deciding between analyzing them on sticky notes or in a word processor, you can now start structuring your data.
Develop an initial structure
Structuring your notes means grouping similar data together, suggesting themes behind the data, naming those themes and deciding which data falls under which theme.
Structuring your notes is an iterative process and not done all at once. When you develop an initial structure, you don’t use all your data. You can start with what you find useful as you skim your notes, or you can use data from two participants first. The aim is to set up a preliminary structure.

If you are analyzing together with others, it usually makes sense for each researcher to start to work on a fraction of the notes themselves in parallel. Let others know when you create a group and consult co-researchers if you are unsure about how to interpret and group a note.
When developing an initial structure, there are two main activities: First you cluster notes into preliminary groups, then you give the groups provisional titles.
Move in proximity
The easiest way to start a structure, is to move similar data in proximity. You do not yet need to commit to a group title, and you can easily try out different ways to organize your data.
Here is a part the analysis where I just moved notes in proximity. Some notes seem vaguely related to be able to do something:
- I need to find time to cook and coordinate it with childcare
- Observation: Has a well-equipped kitchen, with almost all appliances needed.
- “I don’t know how to make a sponge mixture” (so she buys it ready-made)
Some notes that may be related to finding recipes:
- Trying a new diet, thus looking for new recipes
- Kids do not like mushrooms, I have to take this into account when planning meals
- I collect pizza dough recipes; this is my favorite at the moment
- Observation: Has Recipes bookmarked in the cookbook.
Moving notes in proximity can help you experiment with different ways of organizing notes. You may gain more confidence in some of these structures, and you can give them a title by stating the insight related to the group.
State insights
When you clustered some notes together, you can try to find a title for the group. Again, this can be changed later and is there to organize the data and to support your thinking.
Reading your notes and annotations can also lead to possible insight without forming a group first. This is great, too. Just write it down and assign the data to it. Even if you have only one or two pieces of data that fit the insight, don’t worry, just see if you find more data that strengthens the insight. If not, you can still revise the title or just get rid of the group and see where else the data might fit.
For example, these were my first group titles when structuring the data on learning and recipe use:
- customizing recipes
- learning new things
- learning new things with video
- prerequisites
- things
- doing
- remembering recipes
- digital
- analog
- how people choose recipes
- misc (So far I just put all the notes that did not seem to fit well in a large “misc” group)
When analyzing with others, try to review the groups you created until now. It is important that you have a common understanding of the existing structure. This ensures that the results do not fall apart into per-person subsections.
Now, you have some preliminary, data-based themes, each created based on a few data points. Next, try whether these themes are useful for organizing more than just a few data points.
Fill in the structure
Now you have to find out if the structure you created is viable. You created the first structure with only a part of your data. Now you can use all of your data and try to sort it into the themes. You do this just as you created the initial structure: Move data in proximity, add it to groups, give groups titles, or revise existing titles. The titles you write are ideally insights into the underlying data but if that does not work, just choose “same-things-mentioned”-group titles.
If the previous step was to build a (data-based) scaffold, now we try to build the actual walls.
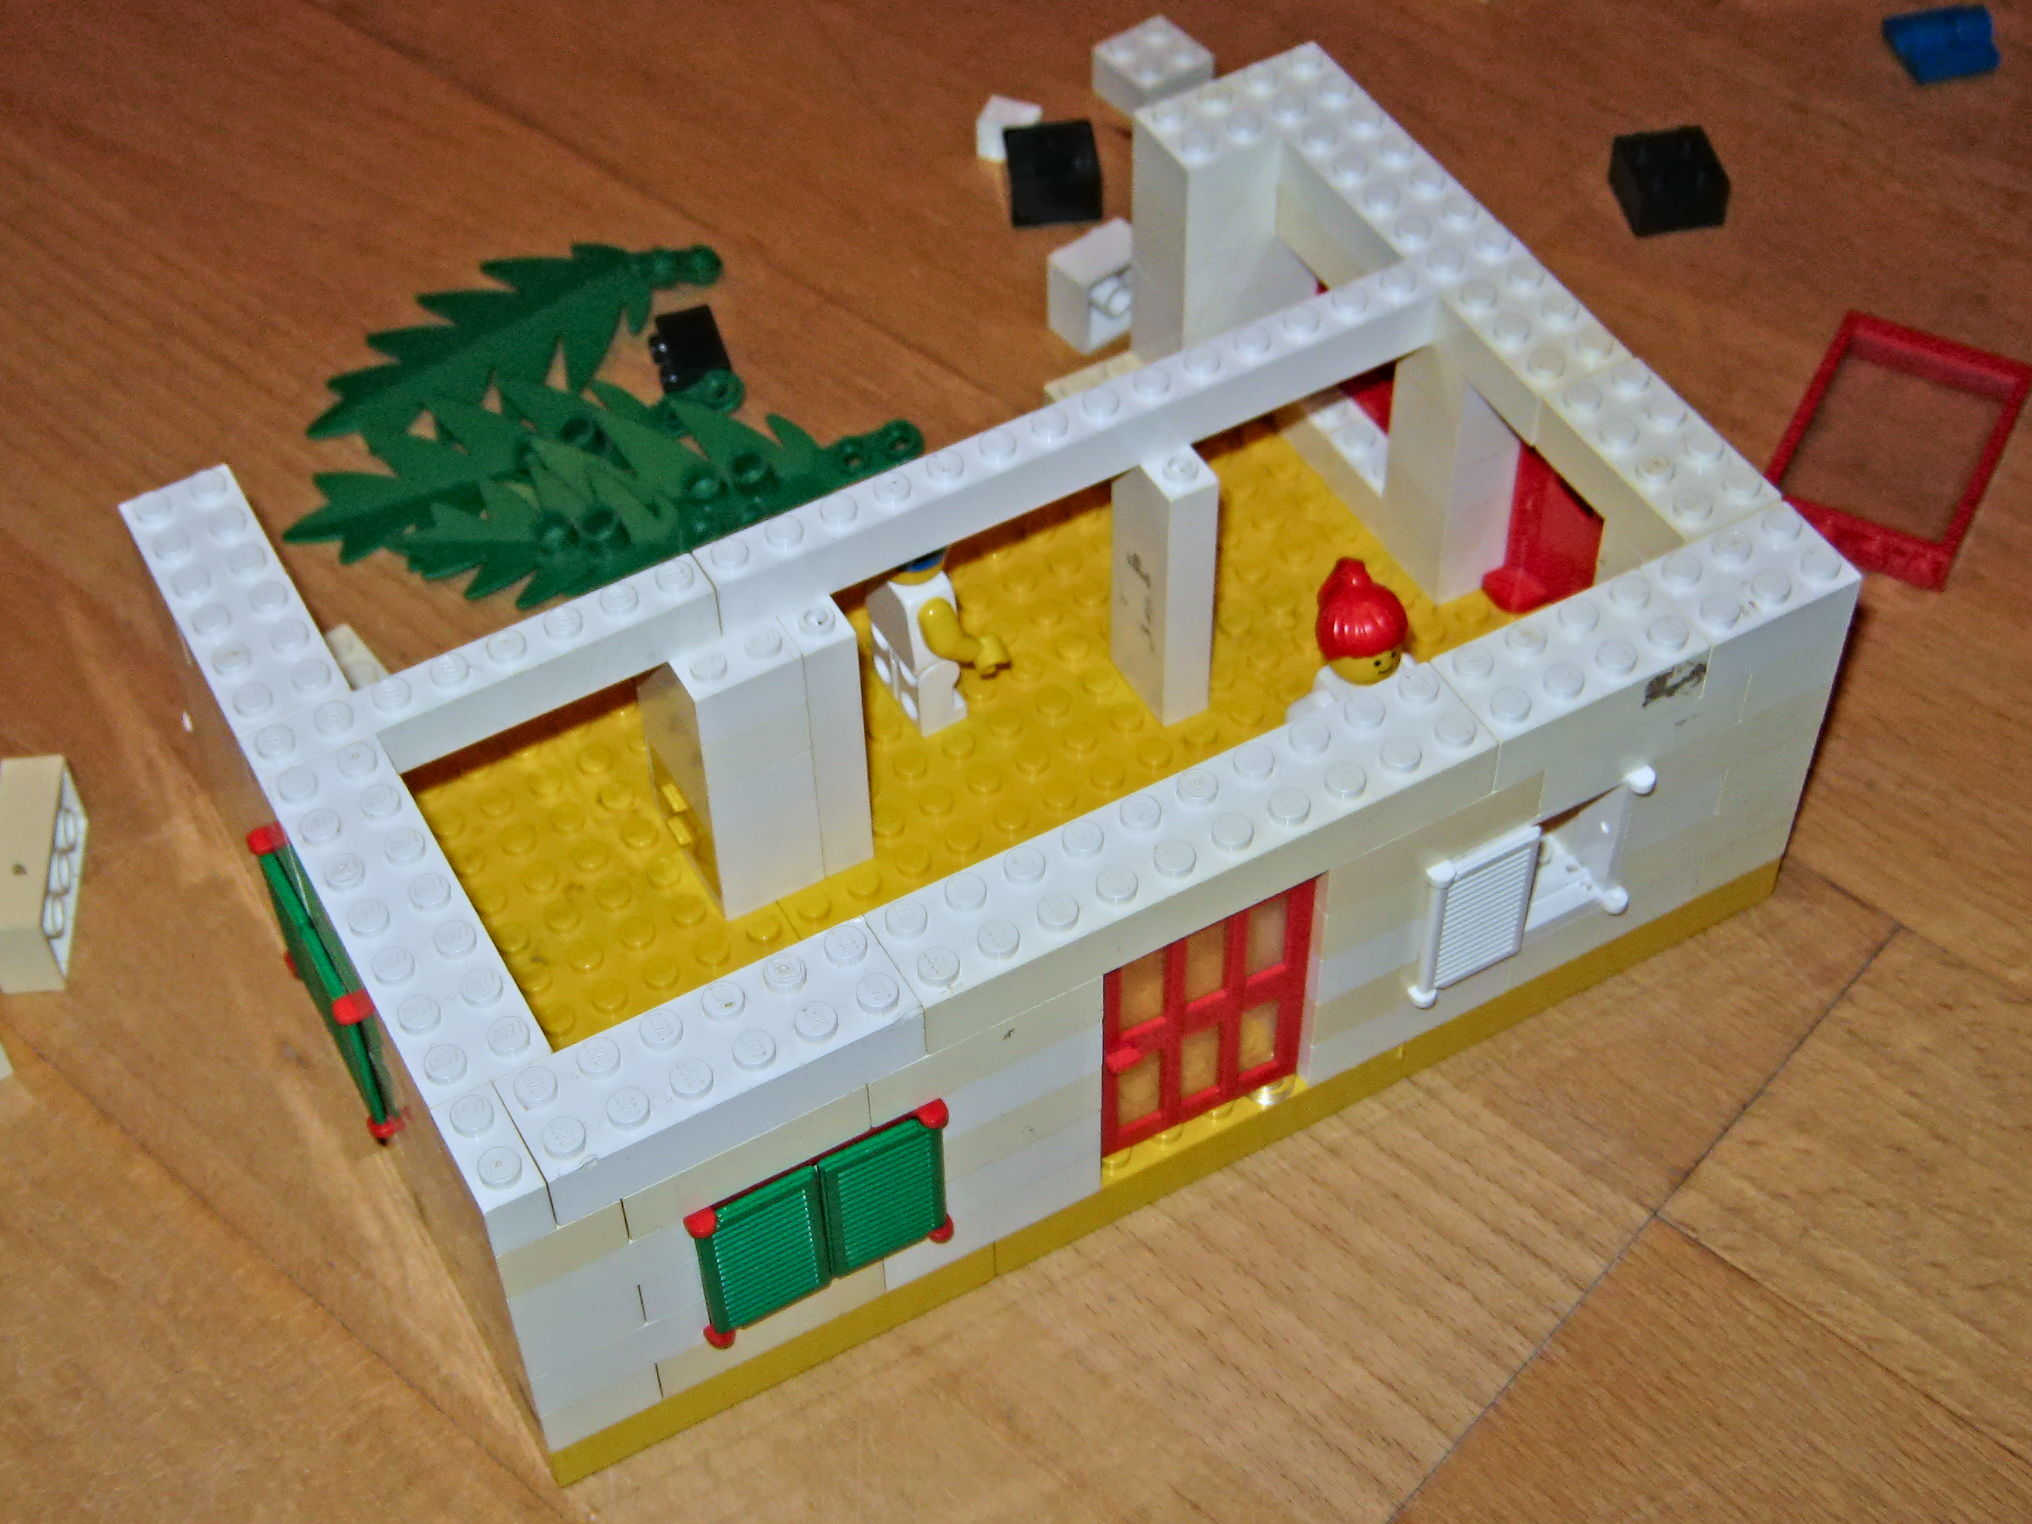
Aim for 3 to 10 data points per theme. While it is okay to have very small groups temporarily, each theme should be derived from multiple data points rather than a single utterance. This does not mean that more is always better: If a theme has more than about 10 utterances or observations, consider splitting it into “sub-themes”.
Normally, I would go through all my notes chronologically, beginning with the first participant and ending with the most recent one—although any other scheme will do. Just make sure you know which data you have dealt with already.
As you add the data to the structure, you may find that you need to create additional themes. Some theme titles may also need to be renamed. Just go ahead and make these changes, if you feel they are necessary.
For example, a group I created early on was “customizing recipes”.
- This is too few oil. I rather add some more
- I added some lemon zest. I like the fresh taste
- It’s fun to tweak the recipe a bit!
This is a good start, but I need to test and improve the structure. There a few points that should be addressed. Based on the participant codes, I could see that the notes in “customizing recipes” came from one person. To see if theme works, I need to see if there are other notes from other research sessions.
As I read more of the notes, I realize that there are not many notes that fit “customizing recipes” in the sense of deliberately adding or changing ingredients: These were mostly from just one participant. But there are notes from research with other participants on not doing exactly what is written in the recipes, like:
- I didn’t have shallots, but I did use onions.
- It tastes good even if I don’t let it simmer for two hours.
I added these notes to the group “customizing recipes”. However, these notes were more about finding good compromises in terms of available ingredients or dietary preferences. I renamed the group to “modify recipes”, which I found to reflect the notes’ content better than “customizing recipes”.
Now your groups will each be informed about several data points. But there will be many themes that are created by the “same things mentioned”-Method, not stating insights. Also, there may be overlapping themes and groups encompassing many data points, while other groups may be informed by only a few data points from just one participant. It is time to revise the structure.
Revise the structure
After you went through your data and sorted it into themes, take a step back and review your results.
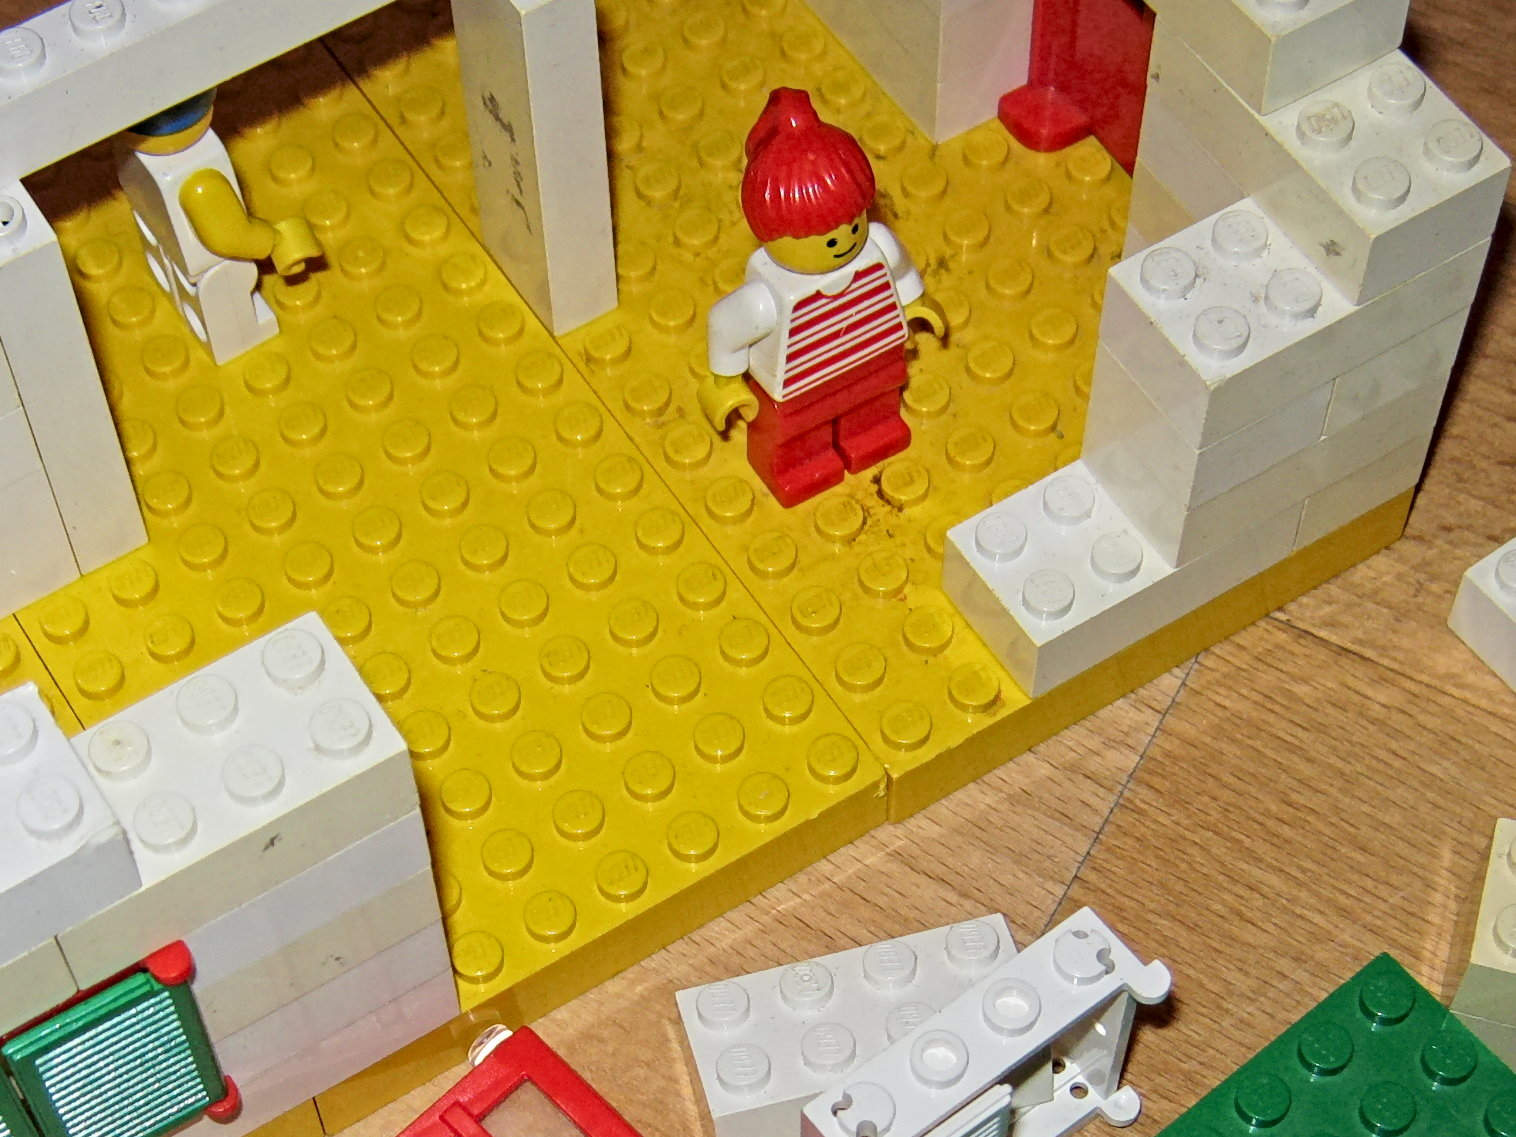
If you analyze collaboratively, take time for a review and collect a list of what is difficult and what works well so far. With this list, you can tackle the problems together.
If you have recently been involved with just a particular part of the analysis (like working on two specific themes), your view may be too narrow: Look at the full range of clustered data, and rediscover themes, which may be a better fit for some data.
Look at the themes in relation to the data they contain: Do they match the data? Revise the themes if there is only a weak match between the stated theme and the data.
Tip: As you create the structure of your analysis, you will keep looking at your notes, images, and diagrams again and again. Sometimes, you have data that is very helpful and expressive: a quote that phrases an insight very well or a photo that illustrates a problem. This data is not only useful for analysis, but also later for presenting your results. You can use it to illustrate how your s are based on concrete observations. As you come across such data, it makes sense to store copies in a separate location for later use when preparing the research report.
There are several typical activities when revising the structure of your analysis: Finding better names for groups, moving data to other groups and creating subgroups.
Find better titles for your themes
Groups based on commonalities or vague similarities will hopefully develop into insights about the participants. To achieve this, try to revise group titles: make them more concise, clear and meaningful. If you named a theme based on mere commonalities of the data in that group, try to state an actual insight for that group.
In my analysis, I had a group I called “recipe reading”, which contained notes like:
- Looks up how much flour to add.
- Proceeds to the next step without reading again.
- Read recipes before deciding what to cook.
- Read recipe when needed.
A more accurate title might be “Participants read recipes occasionally/only when needed”. It was a bit unwieldy, but it made an interesting point: Instead of following recipes like an algorithm, they served more as an occasionally used tool.
However, this new group title no longer fitted all notes anymore, though. I removed “Read recipes before deciding what to cook.” and put it into a temporary group called “misc”. Later, I added this note to the “picking recipes” theme.
Renaming groups usually requires moving some data between groups to accommodate the data to the improved structure, which I discuss in the next section.
Move data to other groups
As you improve your data’s organization, it may be necessary to remove data from groups, either by moving the data to a temporary “misc” group or to another, more appropriate group.
While you should try to use the data you have, the most important thing is to create helpful themes based on the data rather than putting everything in a group, no matter what.
It is possible that you can state an insight more clearly by rewriting the group’s title, but as a result, the clearer title may no longer encompass all data in the group. Make sure the group title is clear, even if it means that the theme does not describe all the data currently grouped under the title. Take out the data that does not fit the improved title and see if it might fit to another group better. If not, place it in a “not yet grouped” or “misc”-Group. Revise this “misc” group, when you made changes to your structure and see, if you can use the data to enhance other groups.
For example, I reviewed a group I called “Problems”. Initially, I put notes here where participants described problems as well as solutions:
- I thought risotto would be nice, but I did not have risotto rice.
- The pizza dough is a bit too cookie-like; I try to improve that.
- I forgot to add the salt (when making the yeast-dough), it obviously did not taste great in the end
- Recipes are difficult to use with dirty hands—in books as well as on the phone.
- …
The group served its purpose well and provided me with structure early in the process. However, it had a fairly broad subject and the data was only related by addressing some sort of problem. I could have structured the problems in different subgroups, but I decided to dissolve the group and see if the data fits somewhere else or helps me to create new groups.
I might put the note on not having risotto rice in a group on altering recipes and the reasons for that. It turned out that missing ingredients and substituting them were really common and the note made sense there. The problematic pizza dough got moved to a group that was called “improving” (Also not an ideal title!). I was unsure what to do with the note on forgetting the salt. I put this note in a misc section where I placed the notes I was unsure about. It later became part of a group on accidental deviations from recipes. The note on recipes being hard to read with dirty hands made a lot of sense, particularly as one of the initial product ideas was to provide recipes and instructions. There were two similar notes by other participants in the “Problems” group. For now, I created a new group called “Recipe handling problems”.
By moving notes to other groups, you can place notes where they make the most sense. In many cases, this means dissolving old groups and creating new ones. But moving data can also be done without major restructuring, simply by moving one or two notes from one group to another because they make more sense there. Another case is not moving data between groups, but creating better structures within groups, which is the topic of the next section.
Create subgroups
When a theme contains a lot of notes, you can create subgroups within a theme. The process of developing subgroups is like in “Develop a first structure” but it only takes place within the group: Move similar data in proximity and try to create clear insight. In this process, you may also find a more appropriate way of framing the main group topic.
Here are the steps I used to break up a large group in my analysis that was called “Reasons to improve skills”. It contained notes like these:
- I looked up how to glaze onions after a recipe mentioned it and I did not know how
- The pizza dough is a bit too cookie-like; I try to improve that.
- A friend suggested I stir-fry the veggies, so I searched for a video explaining it.
- I want to be able to make a mousse au chocolate myself.
- …
As the group grew and grew, it became apparent that it lacked structure.
Going through the notes, I extracted two subgroups. Notes like “I want to be able to make mousse au chocolate myself” and “The pizza dough is a bit too cookie-like; I try to improve that” went into a subgroup that I called “self-directed improvement”. I later renamed it to “Getting skills to cook a certain dish”, as almost all notes in the group mentioned that the participants wanted to create a specific dish themselves.
I created another subgroup with notes like “A friend suggested I stir-fry the vegetables, so I tried to learn about that.” and “I looked up how to glaze onions after a recipe mentioned it and I did not know how”. I originally named these “cooking words”, because learning skills was triggered by reading or hearing a term referring to something they could or should do (“Stir-fry”, “Glaze”)—but they did not know how. However, “Cooking word” is only understandable in context and to make the group title self-explanatory, I renamed it to “Learning skill triggered by learning about a special term.”
Moving notes in these subgroups made the “reasons to improve skills”- group’s content much less unwieldy. Not all notes fit into the subtopics, so I kept some right under the “reasons to improve skills”-group directly, but it was far easier to understand now.
When the structure of your analysis becomes more and more stable, it is time to wrap up your analysis.
Completing your analysis
The steps described above build on each other. But as with other creative tasks, there will be a lot of back and forth between the steps of creating groups, assigning data to them and revising those groups.
This process can take some time. The analysis may never come to an actual halt, but it will eventually slow down. Continuing to move data can still bring minor improvements, but there are no longer major changes.
If you research collaboratively, it is good if you explicitly point out that it might make sense to bring the analysis to an end. Co-researchers may step in and point out issues that need to be fixed before proceeding or just point out minor problems for which suggestions would be helpful. When you decide that your analysis work is complete, take a moment to pause and to celebrate. This is a great achievement after a lot of work.
If you used analog sticky notes, don’t forget to take photos of the wall(s) you did your analysis on. Sticky notes might fall off or colleagues might need the space and remove parts of your analysis, so it is good to make a backup, just in case.
Here is my analysis when I decided that it is complete:
- People do not stick to recipes
- Deliberate adjustments (like cooking a vegan version)
- Spontaneous changes (like swapping ingredients in-action, or adding more of something you like)
- Accidental changes (like forgetting something)
- People do use recipes only occasionally in the process (parts remembered; looking up after steps)
- Acquire Skills
- Watching YouTube channels
- Reading about it
- Asking friends
- Reasons to improve skills
- Learning after reading “special cooking word”
- Knowing a dish and wanting to replicate it
- No reason, just came across it
- Screen, Print, everything is tricky/sticky in the kitchen!
- Washing hands
- It will just get dirty
- Assumed skills and devices
- Compromises if something is not available
- Not choosing if something is not available
- Picking Recipes
- based on ingredients available
- situation-specific
- Strategies for managing recipes
- Printing out
- Just remember/re-search
These are all the groups I created in my analysis. The results could be more concise and have fewer groups focussing on fewer themes. However, this would probably lead to more abstract insights which would be more difficult to use in design.
The groups of groups are partly not insights themselves, but titles for collections, such as “Reasons to improve skills”. Others are direct insights such as “People do use recipes only occasionally in the process”.
By analyzing your data, you structure what you learned in diagrams, notes, and sketches. This makes browsing the data easier, but also helps to gain insights from the data. It builds on the knowledge that you acquired through interviewing, observing and co-diagramming, but goes beyond that: The analysis helps you find non-obvious insights and to corroborate or discard initial assumptions. You and your co-researchers now have an in-depth understanding of the data. However, not everyone can participate in the research. The next step is to summarize your findings and share them with people who weren’t involved in the research, so they can benefit from your findings as well.
Summary
- Making sense of your data and analyzing it helps you to learn more than the obvious insights and to critically reflect your initial ideas.
- Finding commonalities and contrasts in data is a basic principle of analysis.
- There is no one correct result of analysis, but your analysis can be plausible or implausible.
- In the beginning, you organize data by surface similarities of the notes, but over time, you focus on the meaning for the user.
- Prepare your data: Annotate your notes and diagrams by writing down possible interpretations.
- Make sense of diagrams by finding commonalities and summarizing the results in a diagram of your own.
- Make sense of notes by finding possible interpretations, filling and testing your structure and revising it until you find a stable structure.
Sharing research results
This chapter covers:
- Understanding how research gets used
- Putting the most important information first
- Writing an easy-to-read style
- Creating helpful photos and diagrams
- Designing posters for quick and visual research summaries
- Creating slide decks to give an overview of your results
- Writing text-based reports to provide detailed information
After the analysis, your work is almost done. However, people who have not participated in the research do not know anything about the research yet. You need to share your results, so they can learn about potential user’s motivations, activities, and problems. The most visible result for others will be the report or slide deck you create.
Note: Sometimes the documents that are produced in user research are called deliverables—since these are the tangible results you can provide to a client after research.
Documenting your research also has other uses than sharing the results or having an artifact that clients pay for. Creating the documentation continues your sensemaking from data. Now the focus shifts away from themes to priorities and expression: what are the key results? How can you formulate insights succinctly? These questions can also be worked on collaboratively, helping to deepen you and your collaborators’ understanding of the results.
In order for people to engage with your research, they must assume that your research is useful for them. There are three areas where engaging in research can be helpful:
- Finding new directions for product development.
- Choosing between the directions, depending upon what is most promising in the light of the research results.
- Smaller, tactical decisions to be made in everyday design- and product management-work: Which of these features best fits the needs of existing users? What should be emphasized in a blog post promoting the update?
Your research should allow your audience to quickly understand and use the parts that are relevant to them. This will help them to use your research for both strategic and day-to-day decisions and to spread the word about the usefulness of research.
Reports should be easy and quick to understand
There are key principles that make communicating your research easier: a clear structure, easy-to-read style, and well-used visualizations help create reports that are fun to read, use, and share.
Putting first things first
Journalists put the most important information first and end with background information that is useful but not essential. This is known as the inverted pyramid style. You should try to do the same in your research reports. There are two reasons why this is useful to the readers:
- When readers are pressed for time, they get the most important information quickly.
- If the readers have time, it makes them curious to read the rest: you have shown that there are interesting insights, now they want to know more.
Keeping this principle in mind also helps you and your collaborators to think about priorities: There may be many insights, but which are the most relevant? How can they be expressed succinctly and usefully?
A visible expression of these principles are headings, which reflect the most relevant points of the section. Summaries at the beginning of a section serve a similar function. Putting first things first also gets its own section in many research reports: An “executive summary”, a brief overview of the most relevant points of the report.
After you set the priorities of what you want to communicate, let’s look at how you communicate: the writing style.
Easy-to-read style
Writing simple and vivid sentences will help your readers enjoy and understand your insights. A good text has actors and plot like a film scene you can imagine; Bad text feels static, describing gray concepts, arranged in lines of text. In your research, you observed participants in their activities and listened to them describing their motivations and problems. This is a great foundation for writing a text that is interesting to read.
One way to convey activity in your research is using “active” sentences. Active sentences make it clear who is acting: “Joe is looking for a recipe”. You could also write “The recipe retrieval process is initiated by the participant”—that puts the action in abstract, passive concepts and makes it hard to imagine what is going on. If you need an abstract principle, try to still frame it in terms of activities. Maybe you start writing something like “Existing skills are the foundation of the cooking process and are utilized as long as the situation makes sense for participants. Recipes are used when the local sensemaking process breaks down.” A long sentence with a lot of abstract words. However, the content could be interesting and much easier to read: “Participants use their existing skills. They fall back to recipes when they don’t know what to do next”.
As a researcher, you translate experiences of your research participants so that your clients or team members can understand them. “Translate” is not just a metaphor: Participants, clients and team members often use different words. Terms your participants use may be very specific to their context and need to be introduced first. Many people are familiar with cooking, but even in our research, we may need to provide an explanation when quoting a participant speaking about sauséeing. In written reports, I sometimes explain words directly in the text or in footnotes and have also used small glossaries at the end of the reports. In slidedecks, I put such information in the speaker notes and included them in my talk.
Your research reports will be more enjoyable to read when you use action-oriented sentences and think about how to best translate the experience of your participants for your audiences. However, not all content comes as text: it is also important to create good visuals
Clear and helpful graphics
Not all findings are best expressed in text, just as not all data is best collected via conversations. Graphics can be very useful for both showing examples (like a photo of a participant cooking) and conveying abstractions (like showing the workflow steps in a diagram).
Like text, graphics should focus on what is most important: Too many flourishes and elements are distracting. You can often improve graphics by cropping them to the most important parts: If you focus on how people choose recipes, visualize recipe selection, not something else. If your photo illustrates how people knead dough, show the dough and kneading hands almost filling the whole picture rather than a wide-angle shot of the kitchen with a small single person kneading a tiny lump of dough somewhere.
Even if your graphic focuses on the most important content, it can still look unpleasant. This is often the case when elements do not line up and colors differ: There are variations, but it is not clear if they have a purpose or are accidental, like in the next image.

Try to limit the different colors and fonts you use and pick ones that are obviously different. When arranging elements, align them with each other and make sure that repeating elements are evenly spaced. Following these hints will already lead to better looking diagrams:

Many tools like PowerPoint, Slides or Illustrator have distribution and alignment features that save you the work of moving all elements manually.
Tip: Designs, diagrams and picking photos needs expertise. If you can work with a visual designer, you can save yourself a lot of work and get high quality results.
Visual elements like diagrams and photos should, like text, be focused on a clear purpose and avoid elements that detract from this purpose. Avoid flourishes, crop images to their most important content and use few fonts and colors in diagrams. This looks good and helps readers to make sense of the content quickly.
Common forms of documentation
I will introduce you to three ways to summarize your research: Posters, slide decks and reports. These formats have different strengths, and complement each other. For a large project, you might create all three, while for a smaller project you might deliver only a slide deck or report.
Posters
The great thing about posters is that they can become part of the environment the design team works in. The poster can be a reminder of the most important results, and team members can refer and point to it in conversations.
Posters are the most compact way to summarize your research: Only the most important results get on a poster. Text should be short and structured with headings. You can use graphics to their full potential on a poster. Complex processes or diagrams often suffer from the limited space they get in other media. Here they shine.
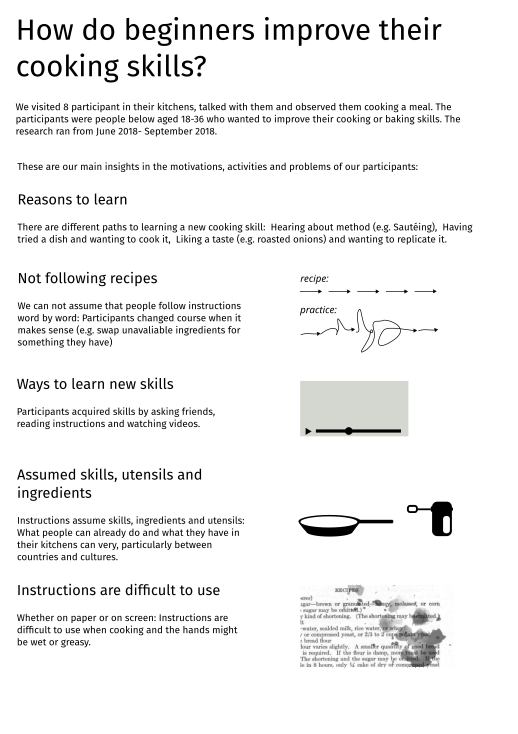
Other formats of posters may focus on a specific finding and visualize in-depth. I did not do this for the research on using cooking instructions. The following image is an example from research I did on cleaning and transforming data before importing it into a public database, using multiple tools and skills from different domains:
Tip: Professional designers create posters in a desktop-publishing application like Adobe InDesign—but in many cases, a presentation application like PowerPoint works well too.
Tip: If you have an office printer that prints A3, you can use it for a small poster; Large format printers in print shops can print larger posters.
Posters can only provide limited information. This is a strength, as it helps you focus, but to provide background information and results that go beyond the essential findings, you can document your research in a slide deck.
Slide decks
Slide decks are versatile: they can serve both as a medium for documentation and provide important points and visualizations in a personal presentation. The limited space on each slide helps you to stay focused and write concisely. The slide format makes it possible to try different sequences and to put together longer or shorter decks depending on the information needs.
I often structure my slide decks like this:
- Title
- Research project question
- Executive summary: One slide with the most important results
- Brief research method description
- Result 1
- Result 2
- …
- Takeaways (Similar to executive summary)
There are different ways to organize information on a slide. A lot of research insights can be presented in lists:
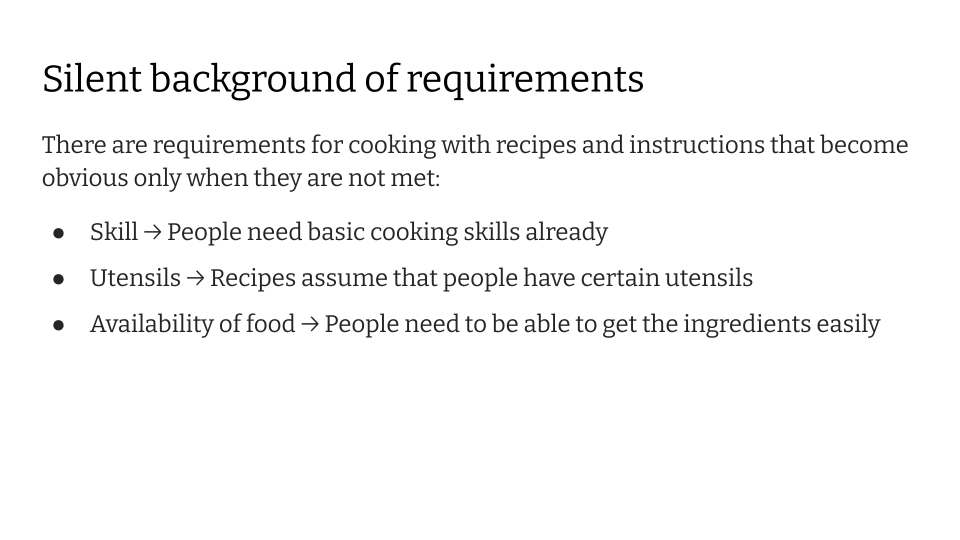
Research results can feel quite abstract. One way to convey what you saw and heard while researching is by sharing quotes and image examples:
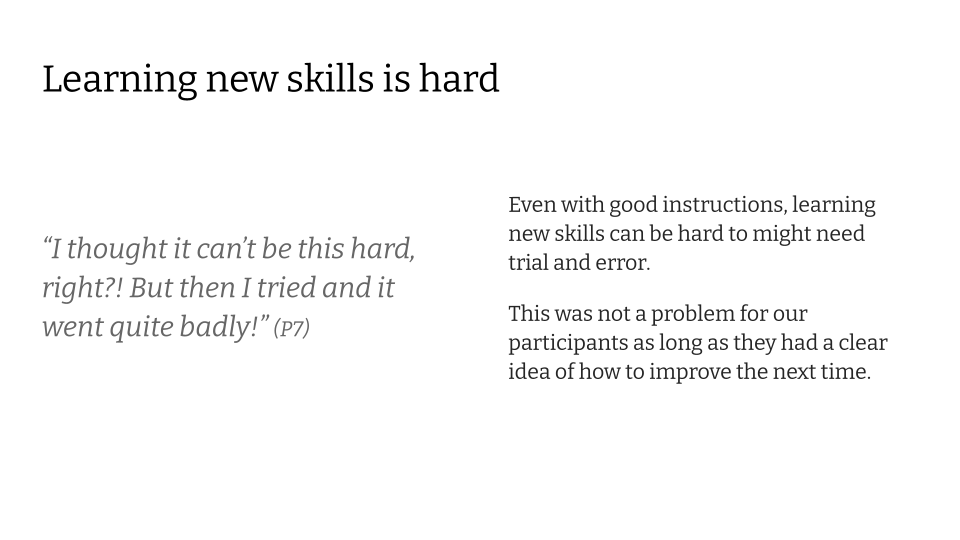
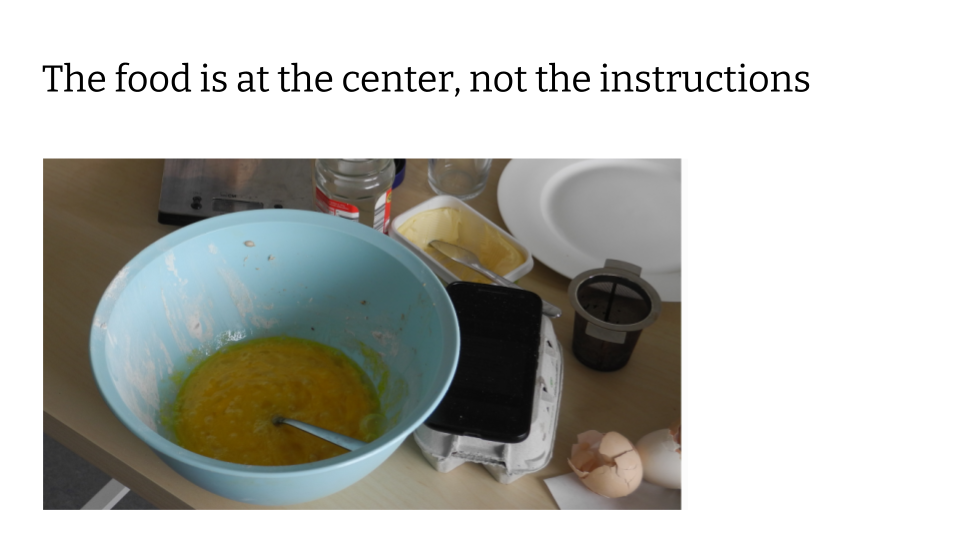
You can use the slides to show diagrams and other forms of visualization. In the following slide, I visualize that recipes seem straightforward, almost like algorithms, but that the actions that people do based on the recipe are far more complex:
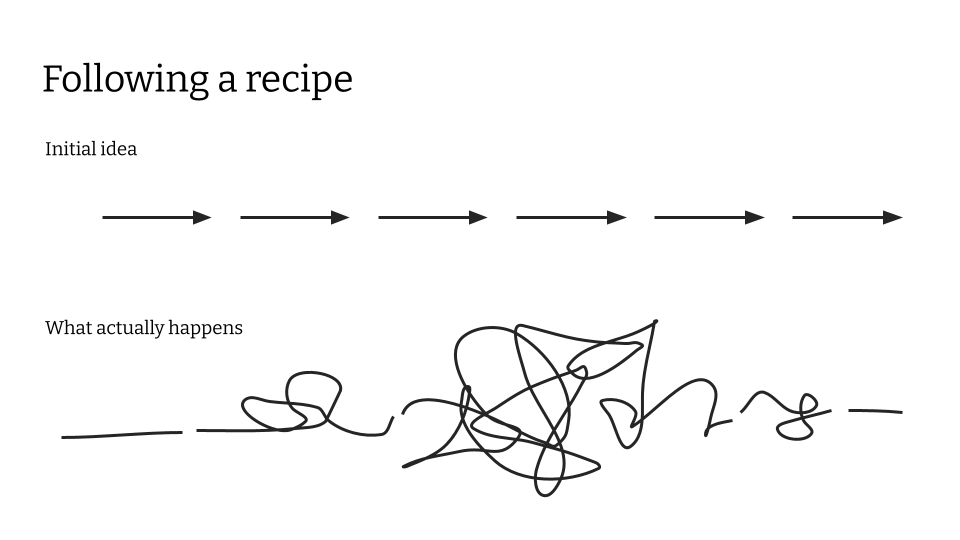
One format I haven’t used to present the results of recipe usage research, but that can be useful, is to compare, for example, which factors support and hinder the use of a tool.
Such a summary is useful for evaluating (product) decisions and you can place it after the executive summary.
Note: There is some contradiction between what should be on slides for documentation and what should be on slides for presenting in person. For presenting, slides should ideally avoid repeating points you are talking about—slide decks by professional speakers are often just illustrations and examples! If you want to deliver a top-notch presentation, consider creating a separate deck.
Slide decks are a standard format for documenting research results and are used beyond their original purpose of providing images and graphics for presentations. The format affords highly structured text and the use of illustrations and thus matches the needs of ad-hoc use and quick comprehension. However, it can be difficult to discuss complex issues and to provide background information for those who want to dig deeper. It is best to create a written report for these needs.
Reports
Written reports enable you to discuss results and methods in detail. They require concentrated reading. Depending on the research, a report can be about 15-50 pages long and can include a description of the methods, recruiting process and research session questions in an appendix. This makes them a good format for readers who need to deeply engage with the topic, but also for archiving and later reusing research results. The written report allows presenting the relevant context, motivations, and reasoning. This helps readers understand research results even years later.
The basic structure of a report can be the same as that of a slide deck. In the case of a written report, it can be useful to include an appendix with a description of the method and a more detailed discussion of the results.
- Title
- Executive summary listing results, research question and brief method description (see the following image)
- Results
- Result 1
- Result 2
- …
- Result summary
- Appendix
- Detailed description of research methods
- Recruitment method and sample
- Research session questions (“interview guide”)
- …
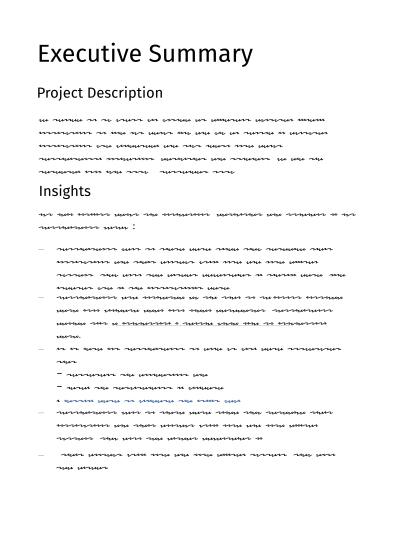
Even if written reports demand focused reading, they should still be easy to understand and provide important information quickly. They should have an executive summary, and you can also summarize key points of their sections, much like in the chapters of this book.
Reports allow you to detail your findings and provide background information for readers who want to delve deeply into the research and its methods. They are not the ideal medium for a quick overview. Your reports, no matter how extensive, will be built upon by their readers when they move beyond the immediate research results towards decisions and designs.
Beyond reporting research results
For you, the research project usually ends with you documenting your research and presenting it to the team or other stakeholders. But the use of the research results has only just begun: If all goes well, team members and other colleagues will read use your posters, slidedecks and reports and share them with colleagues. They will also use the research to create documents slightly removed from research and more focused on design or business decisions: Personas, empathy maps, scenarios, or story boards.
When your research reports are easy to understand and provide interesting information, product managers, designers, developers, and writers will use them to learn more about your participants and thereby creating products that match your user motivations, activities, and problems.
Summary
- Research results can be used for strategic decisions as well as for smaller tactical ones.
- Structure the information inverted-pyramid-style: The most important information comes first.
- Use an active, concrete style.
- Focus your graphics on their core message and avoid elements that do not contribute to it.
- Posters give quick and visual research summaries.
- Slides give an overview of your results that is easy to consume.
- Written reports give in-depth information.
Appendix
Learn (even) more
Books
Design focused
These books are written for designers and user researchers. The methods and examples are immediately useful for design work.
- Observing the User Experience : A Practitioner’s Guide to User Research by Goodman, Elizabeth; Kuniavsky, Mike; Moed, Andrea. 2nd Edition. Amsterdam: Elsevier, 2012. ISBN 978-0-123-84870-3
Covers multiple user research methods as well as research planning, recruiting and communicating results. Particularly interesting are the chapters on recruiting and analysis of qualitative data. - Interviewing Users : How to Uncover Compelling Insights by Portigal, Steve. 1. Edition. New York: Rosenfeld Media, LLC, 2013. ISBN 978-1-9-33-82-0
As the title suggests, it’s focused on asking questions and listening to answers, but it covers additional methods as well. Includes lots of useful tips. - Rapid Contextual Design : A How-to Guide to Key Techniques for User-centered Design by Holtzblatt, Karen; Wendell, Jessamyn Burns; Wood, Shelley. Amsterdam: Elsevier, 2005. ISBN 978-0-123-54051-5
Describes a collection of methods for user research. It is aimed at bigger teams (with time and money, I assume). However, its mentioned here since the idea of grouping data as core activity of data analysis is from it. - Mental Models: Aligning Design Strategy with Human Behavior by Indi Young. Rosenfeld Media. ISBN-13: 978-1-933-82006-4
Describes a research process with lots of useful methods and structures going from participant group selection up to sharing research based product feature opportunities. A particular focus is on user activities and recruiting based on them.
Academic focus
These are books written for academic researchers. Why should you bother with academic books if there are some specifically for designers? Books aimed for an academic audience also cover topics that are easily brushed over. This might be ethics, data analysis and different paradigms for it and the question if there are a “true findings”. All this can be very useful if you find yourself researching sensitive topics, need to come up with custom methods or if you need to explain and defend a particular approach.
- Shane, the Lone Ethnographer: A Beginner’s Guide to Ethnography by Galman, Sally Campbell. Lanham: Rowman Altamira. ISBN 978-0-759-10344-3
Lots of the methods I described originated in ethnography. This book gives a hands-on and thoughtful introduction to ethnography. Comes as a comic and is fun to read. Minor flaw: The lettering is a bit obscure - The Good, the Bad, and the Data by Galman, Sally Campbell. Walnut Creek, California: Routledge, 2017. ISBN 978-1598746327
Shane is back and now she focuses on data analysis. Great overview of established paradigms. Like the “Lone Ethnographer” it is a comic and easy to understand. I think the lettering’s readability was improved a bit. - Successful Qualitative Research : A Practical Guide for Beginners by Clarke, Victoria; Braun, Virginia. London: SAGE, 2013. ISBN 978-1-847-87581-5
This book is aimed at aspiring academic researchers. Hands-on, but covers the underlying (social science) theory as well. It inspired much of the analysis section in this book. Interesting for those who want to know more about doing thorough analysis of data (using the method of “Thematic Analysis”) - The Ethnographic Interview by James P. Spradley. Waveland Press. ISBN-13: 978-1478632078
Focuses on understanding the participants’ language and jargon and consequently less on participants’ activities. Nevertheless, a great intro, particularly the annotated examples.
Examples
- Watch a demonstration of interviewing methods (by Graham R Gibbs, CC-BY-NC-SA)
- Example Interview Guides (by Erin Richey, CC0)
Forms and Templates
Co-Documentation Templates
If you read this on a computer, you can download the templates via right-click → “save image as”


